This guide will explain how to perform bootstrapping in Excel.
Since Excel contains several built-in functions and tools, it is an excellent tool for performing statistical calculations and tasks. Aside from the common sampling methods, we can also perform sampling with replacement, such as bootstrapping.
When conducting a study or research, we usually just draw data from a sample rather than the entire population. Furthermore, there are two methods of collecting samples. So one method is sampling with replacement, and another is sampling without replacement.
So bootstrapping is a type of sampling with replacement. Essentially, sampling with replacement can have one data value appear multiple times in the sample. And the data in the sample are independent, meaning they are not affected by a previous result.
So bootstrapping is a sampling with replacement method that is used to construct a confidence interval for a statistic when the sample size is small, and the distribution is unknown. Additionally, bootstrapping can also be used to estimate a summary statistic like mean or standard deviation.
Let’s take a sample scenario wherein we need to perform bootstrapping in Excel.
Suppose you have a list of data values. And we need to generate bootstrap samples for each data value. Then, we want to calculate the statistical interest for each bootstrap sample.
And you want to perform the entire process in Excel to make your work easier and faster with the help of the built-in functions and tools.
Before we move on to a real example, let’s first learn how to write some functions we will use to perform bootstrapping in Excel.
The Anatomy of the MEDIAN Function
The syntax or the way we write the MEDIAN function is as follows:
=MEDIAN(number1, [number2])
Let’s take apart this formula and understand what each term means:
- = the equal sign is how we begin any function in Excel.
- MEDIAN() refers to our
MEDIANfunction. And this function will return the median or the number in the middle of the selected data set, range, or set of given numbers. - number1 is a required argument. And this refers to any number from 1 to 255 numbers or names, arrays, or cell references containing numbers we want to find the median.
- number2 is an optional argument. So this is simply another number from 1 to 255 numbers which we want to find the median.
The Anatomy of the PERCENTILE.INC Function
The syntax or the way we write the PERCENTILE.INC function is as follows:
=PERCENTILE.INC(array, k)
Let’s take apart this formula and understand what each term means:
- = the equal sign is how we start any function in Excel.
- PERCENTILE.INC() is our
PERCENTILE.INCfunction. And this function is used to return the k-th percentile of values in a given range where k is in the range of 0 through 1. Additionally, this is an inclusive function. - array is a required argument. So this refers to the array or range of data we will define the relative standing.
- k is another required argument. And this refers to the percentile value that is between 0 through 1 that is inclusive.
Great! Now let’s dive into a real example of performing bootstrapping in Excel.
A Real Example of Performing Bootstrapping in Excel
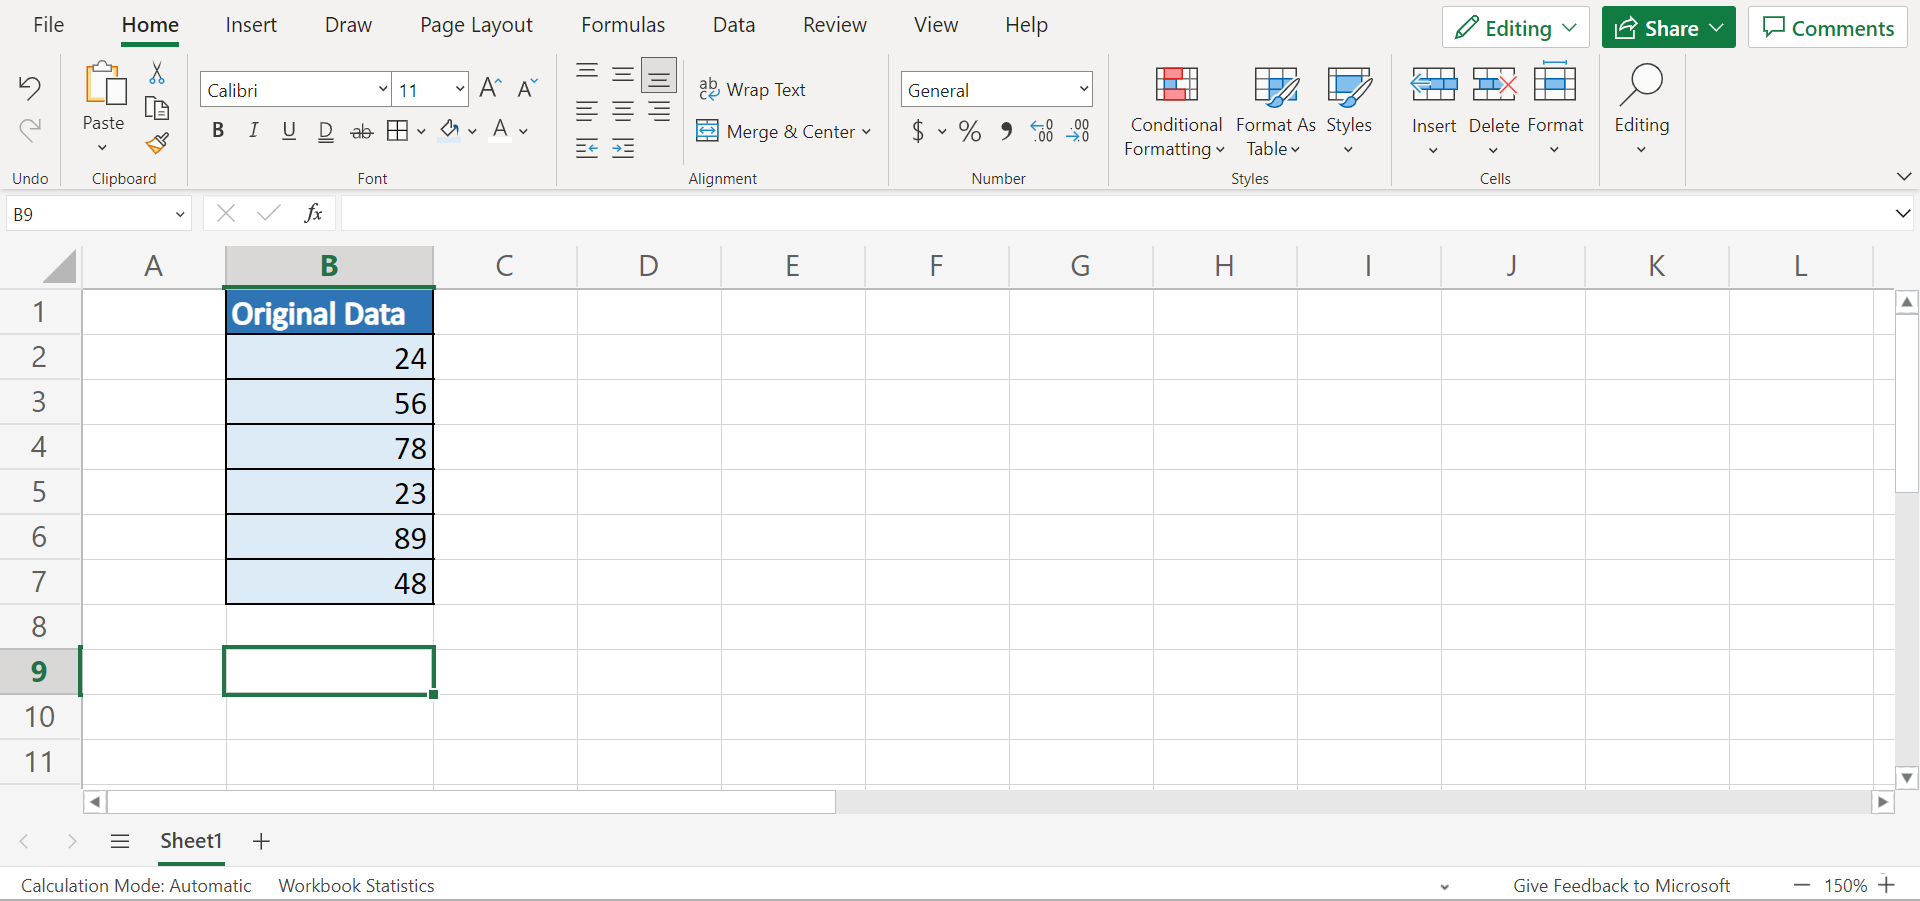
Let’s say we have a list of data values containing numerical values. And we need to perform bootstrapping to get a sample. Then, we will calculate the statistics of the bootstrap sample. So our initial data set would look like this:
So bootstrapping is a resampling technique used to estimate statistics on a population by sampling a given data set with replacement. Firstly, we take k repeated samples with replacement based on a given data set.
After obtaining a bootstrap sample, we can calculate the statistic we want to find. Then, we will end up with k different estimates for a specific statistic which we can use to calculate a confidence interval.
And this process is easier and faster in Excel. Firstly, we will generate a bootstrap sample using a formula combining the INDEX function and the RANDBETWEEN function.
Secondly, we can utilize the built-in statistical function to calculate the mean, median, standard deviation, and many more for every bootstrap sample. Lastly, we can calculate the confidence level of the bootstrapped sample using the PERCENTILE.INC function.
And our final data set would look like this:

You can make your own copy of the spreadsheet above using the link attached below.
Amazing! Now we can move on and learn the process of how to perform bootstrapping in Excel.
How to Perform Bootstrapping in Excel
In this section, we will explain the step-by-step process of how to perform bootstrapping in Excel. Furthermore, each step contains pictures and detailed instructions which you can easily follow.
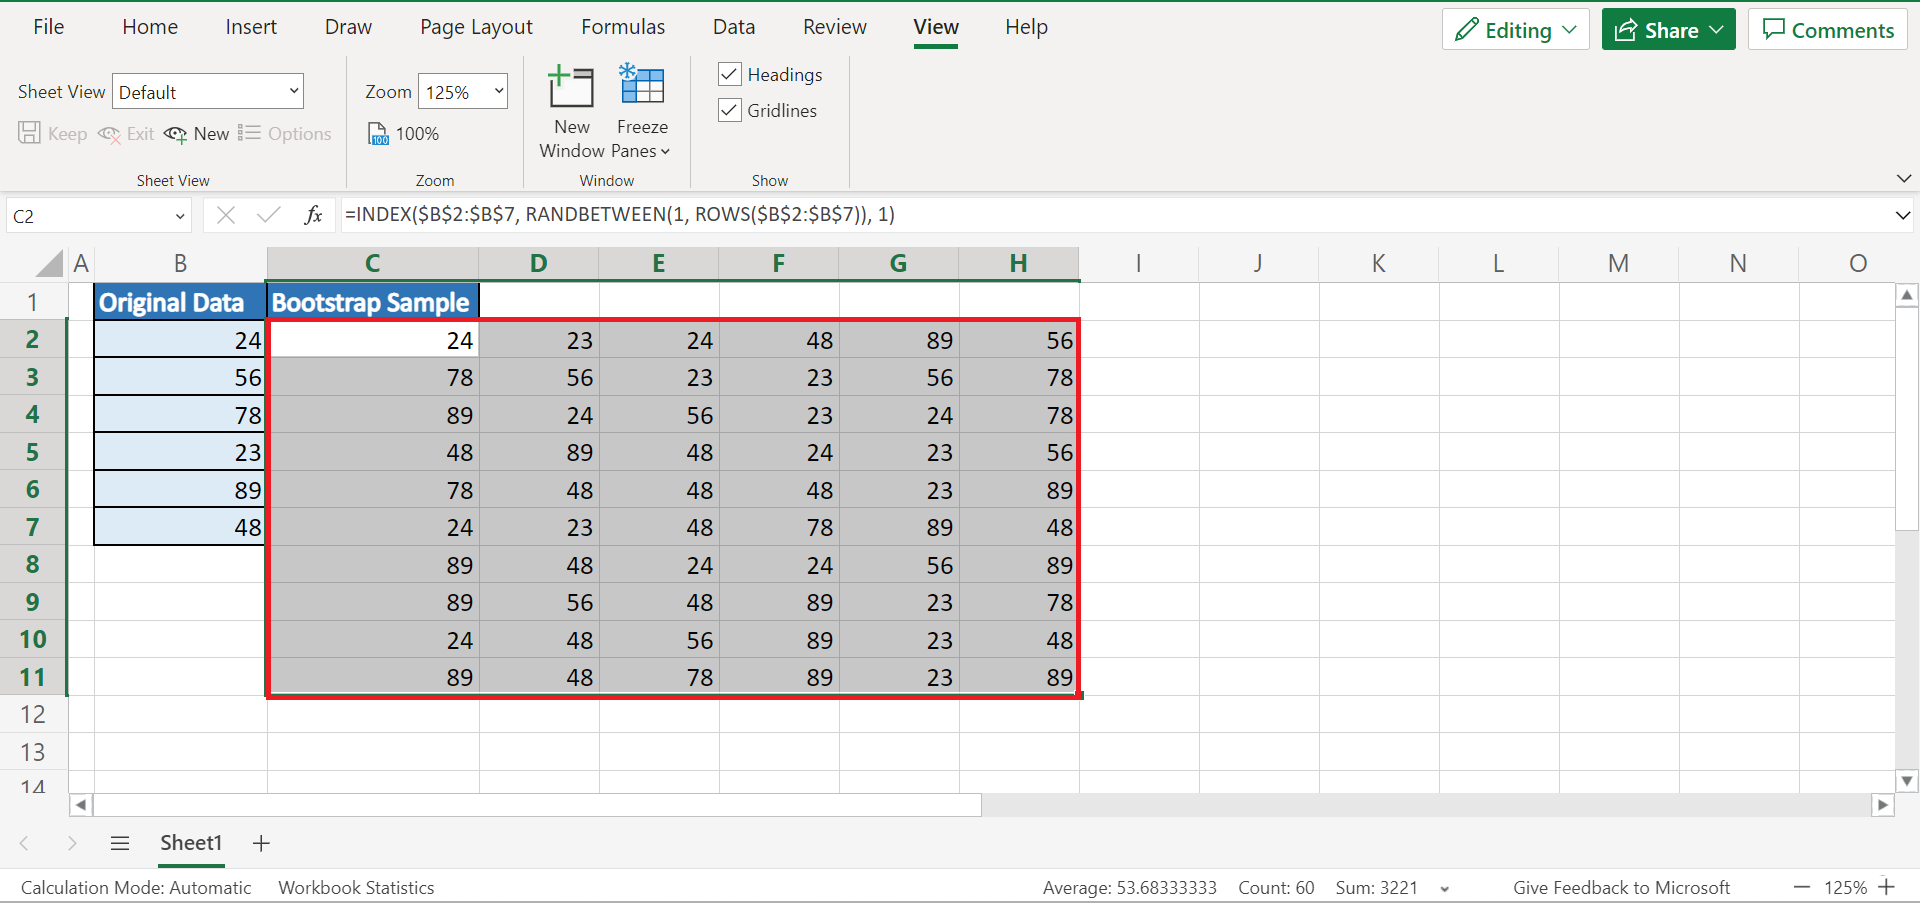
1. Firstly, we need to generate bootstrap samples for our original data set. In this case, we only want to generate 10 bootstrap samples. So we can simply type in the formula “=INDEX($B$2:$B$7, RANDBETWEEN(1, ROWS($B$2:$B$7)), 1)”. Then, we will press the Enter key to return the result.

2. Secondly, we will drag the Fill Handle tool to the right for 5 cells to generate our first bootstrapped sample. Then, we will also drag down the Fill Handle tool to 10 cells to obtain our desired 10 bootstrap samples.
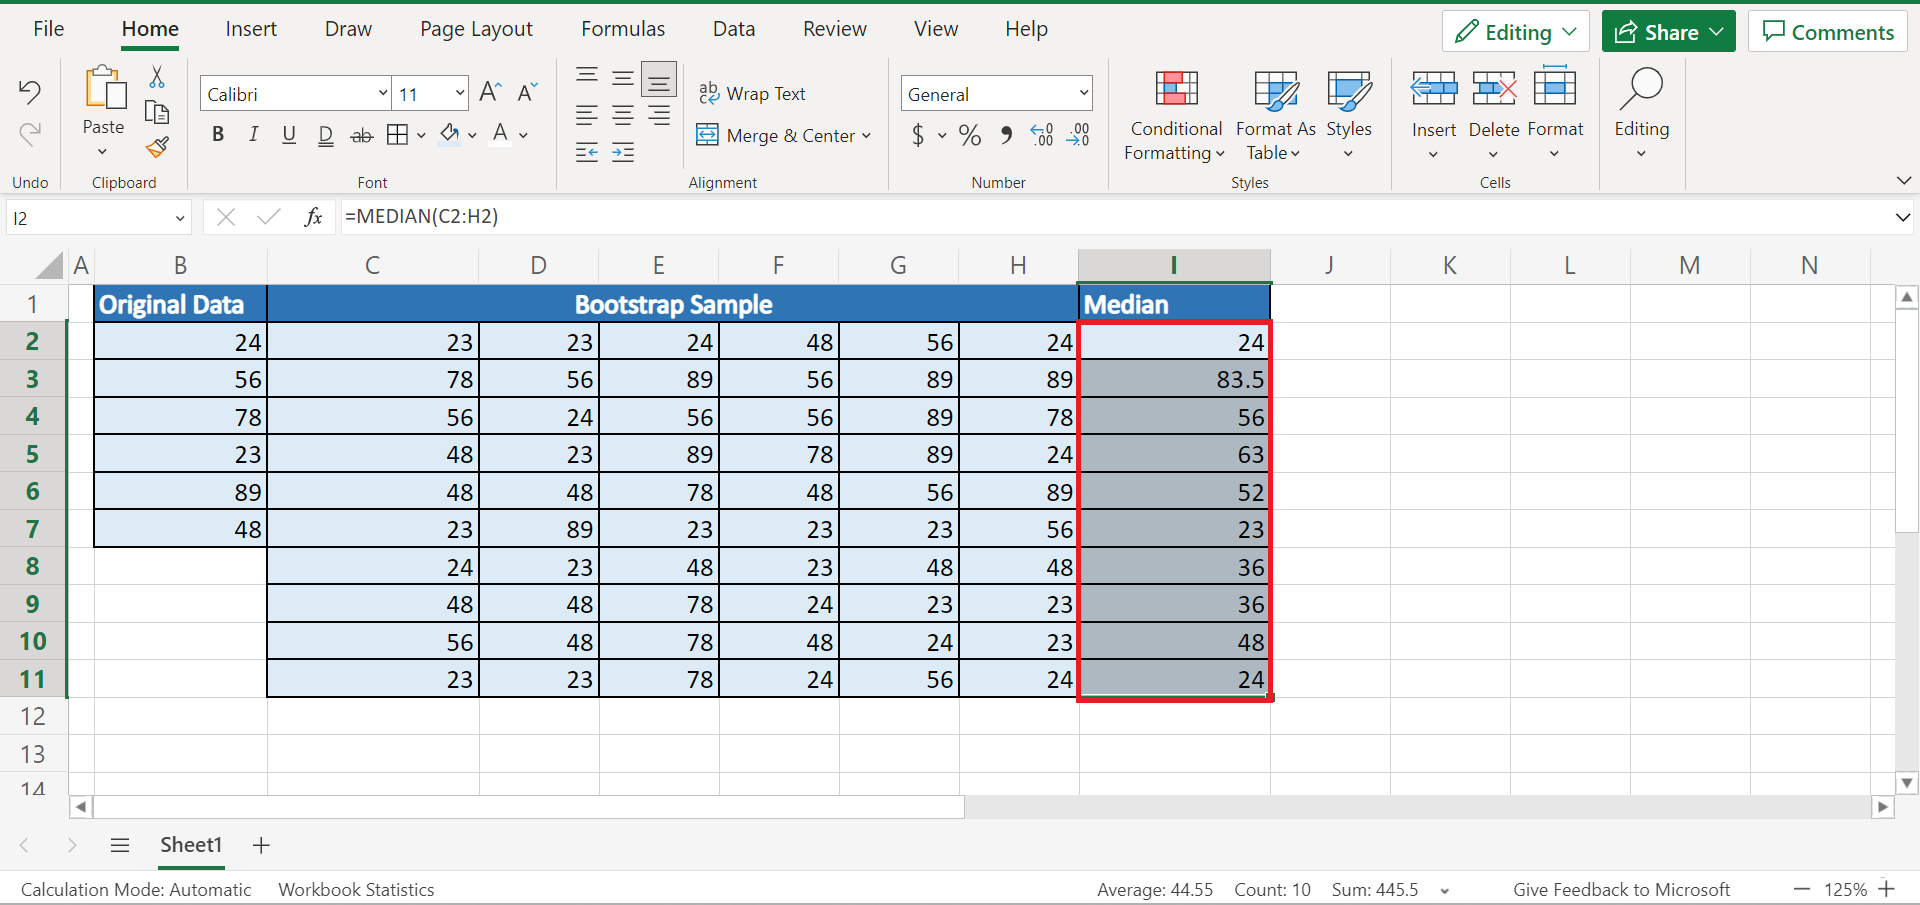
3. Thirdly, we can begin calculating the statistics for each bootstrap sample. In this case, let’s calculate the median for each bootstrap sample. So we can input the formula “=MEDIAN(C2:H2)”. Lastly, press the Enter key to return the result.
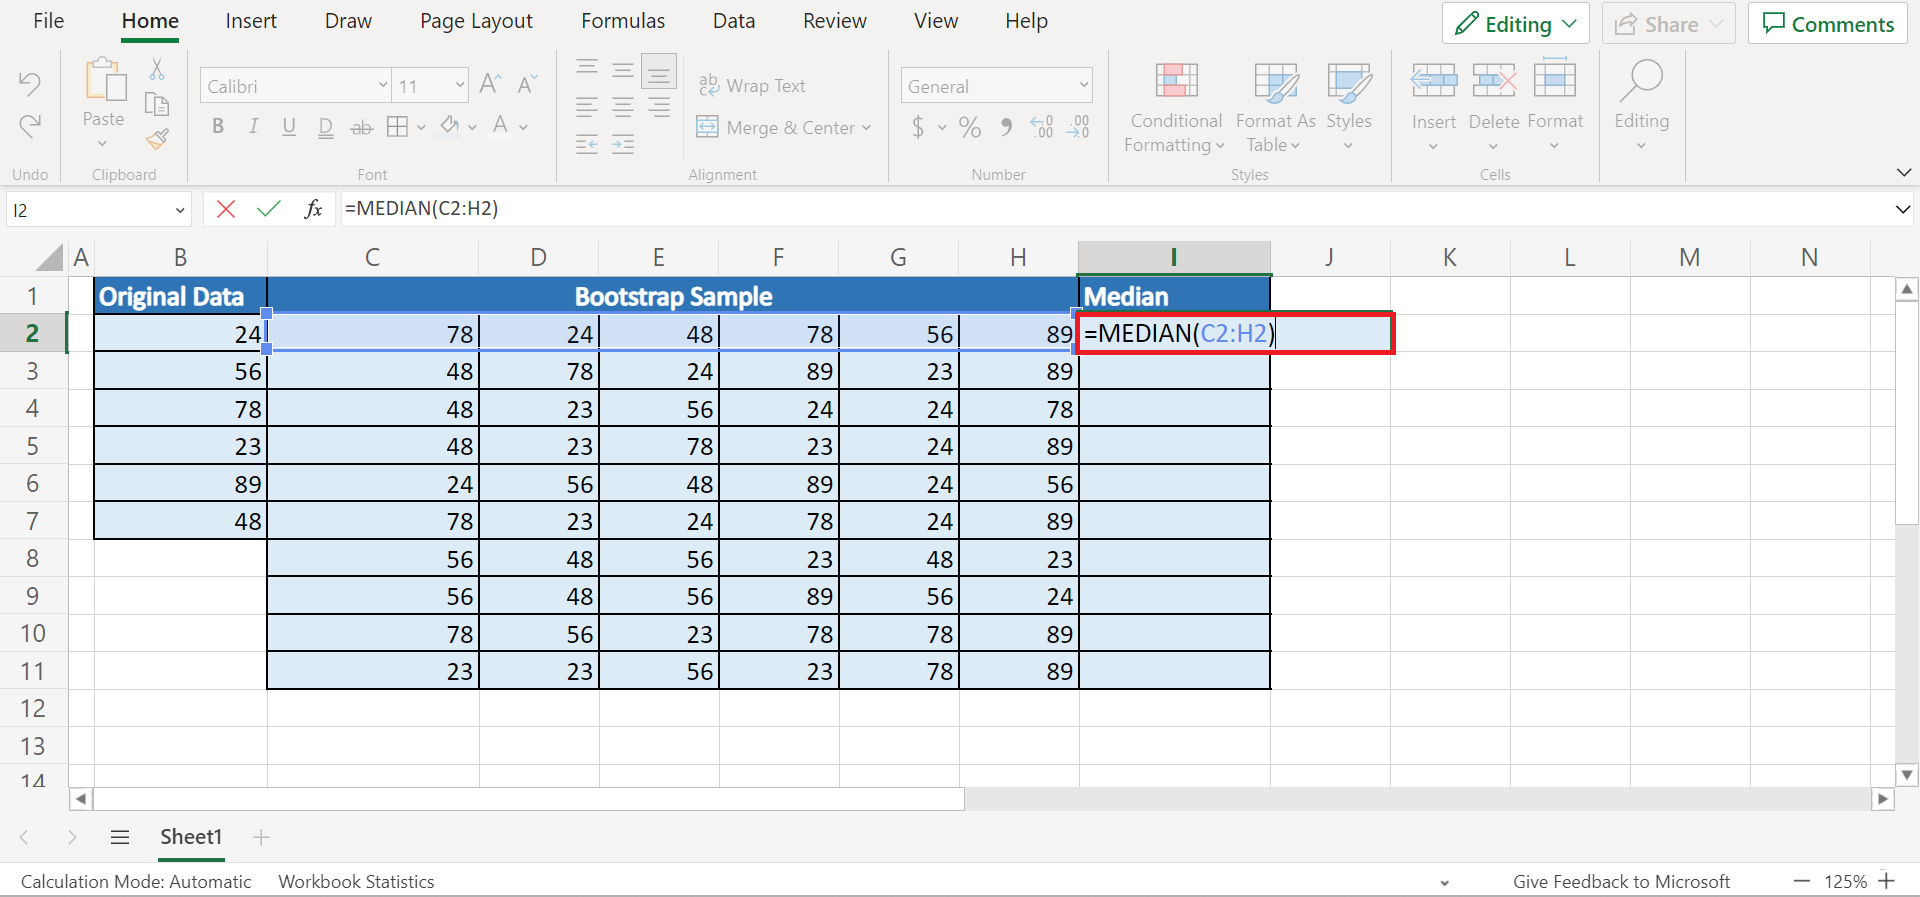
4. Then, we can drag down the formula using the Fill Handle tool to obtain the median of the other bootstrap samples.
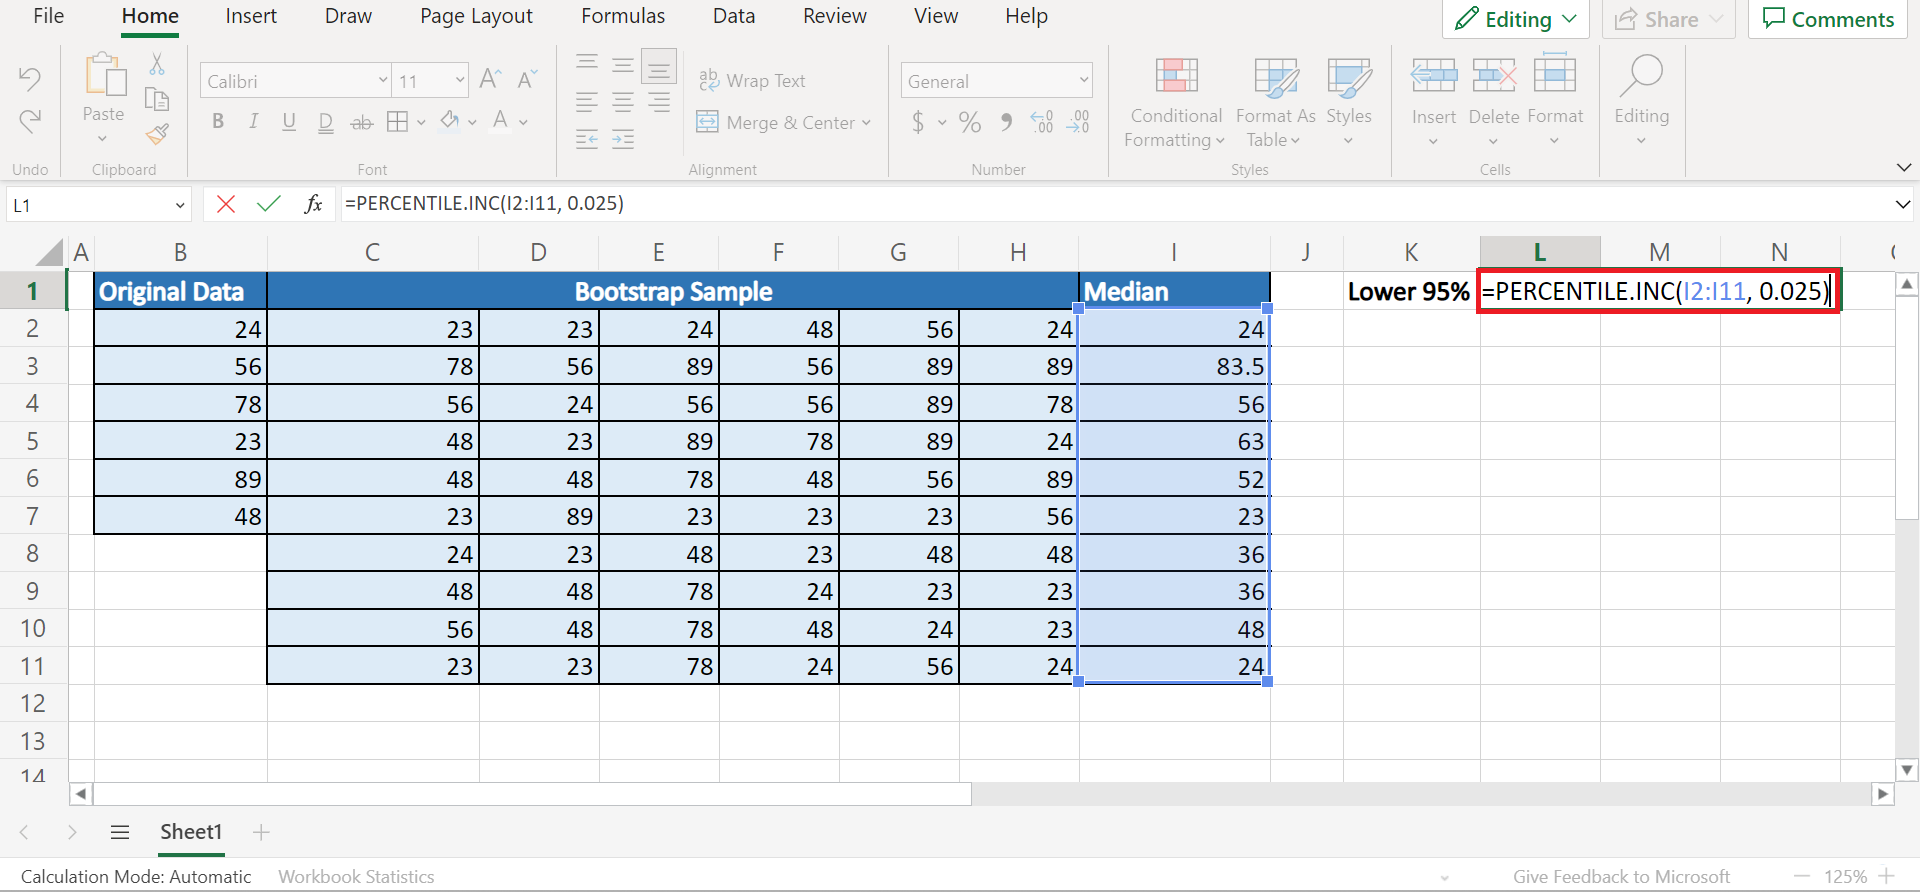
5. Next, we will calculate the confidence level of the bootstrapped sample. To do this, we will be using the PERCENTILE.INC function. So we will type in the formula “=PERCENTILE.INC(I2:I11, 0.025)”. Finally, we will press the Enter key to show the result.
6. And tada! We have successfully performed bootstrapping in Excel.
And that’s pretty much it! We have discussed how to perform bootstrapping in Excel. Now you can apply this learning to your own work whenever you need to perform bootstrapping to your data set.
Are you interested in learning more about what Excel can do? You can now use the PERCENTILE.INC function and the various other Microsoft Excel formulas available to create great worksheets that work for you. Make sure to subscribe to our newsletter to be the first to know about the latest guides and tutorials from us.