We can perform a partial F-test in Excel by using multiple linear regression on both the full and reduced models. Excel’s Analysis Toolpak provides the necessary tools to calculate the values we need to perform the F-test.
Statisticians use a partial F-test to determine whether a particular regression model and one of its nested models have a statistically significant difference between them.
A nested model is a type of regression model that contains a subset of predictor variables found in another regression model.
For example, let’s consider two different models that aim to predict the height of a tree. Model A uses four parameters: tree age, soil quality, climate, and species. Model B aims to predict tree height using the amount of sunlight as an additional parameter aside from the four present in Model A.
Since Model A contains a subset of parameters found in Model B, Model A is a nested model of Model B.
In this guide, we will explain how to determine whether a statistically significant difference exists between a regression model and a corresponding nested model.
We will cover how to use the Regression tool with the Analysis Toolpak add-in to quickly find some key statistics required to perform the F-test.
Let’s dive right in!
A Real Example of Performing a Partial F-Test
Let’s explore a simple example where we might need to perform a partial F-test.
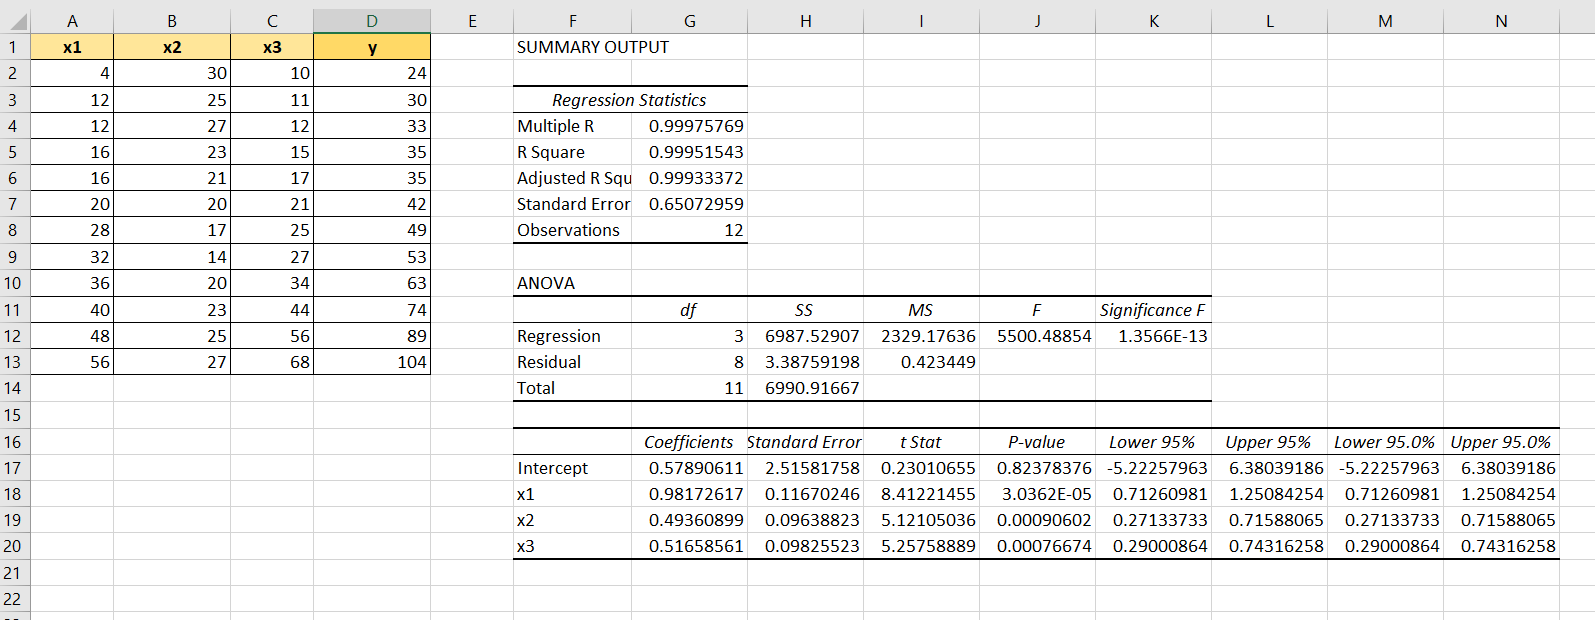
In the table seen below, we have a dataset with three independent variables, x1, x2, and x3. Our dataset includes a single dependent variable labeled y. We want to know if there is a significant difference when we remove one of these independent variables.

A partial F-test can be used to determine whether the nested model without one of the independent variables significantly differs from the model with the full set of variables.
We can use the formula seen below to compute the partial f-test statistic of our two models.

Users can work with the Analysis Toolpak Excel add-in to determine the RSS Reduced and RSS Full values.
Do you want to take a closer look at our examples? You can make your own copy of the spreadsheet above using the link attached below.
Are you curious about how we set up our spreadsheet? Head over to the next section to read our step-by-step breakdown on how to do it!
How to Perform a Partial F-Test in Excel
This section will guide you through each step needed to perform a partial F-test in your Excel spreadsheet. You’ll learn how we can use the Analysis Toolpak add-in to create a summary output of a multiple linear regression model for both the nested and overall regression models.
Follow these steps to find the partial F-test statistic in Excel:
- First, we must activate the Analysis Toolpak add-in in our Excel program. Click on the File tab to proceed.

- In the File tab, click on the Options button found in the bottom left-hand corner.

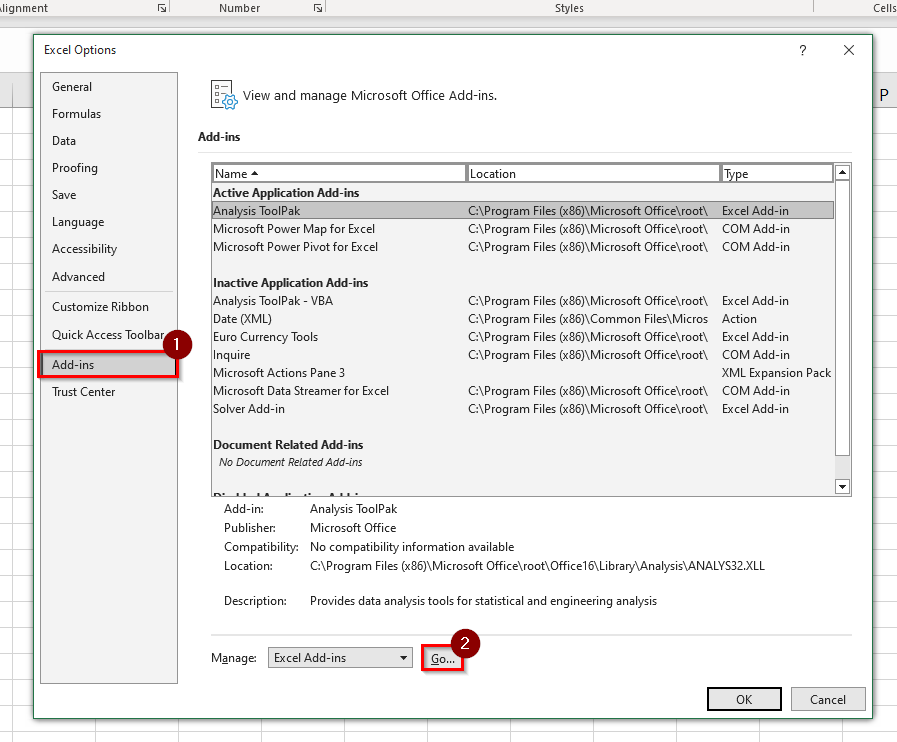
- In the Excel Options dialog box, click on the Add-ins tab and select Go…
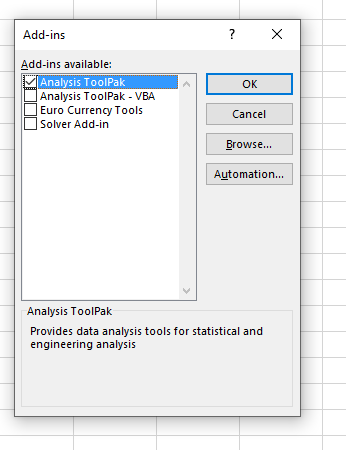
- The Add-ins menu will list all available add-ins for Microsoft Excel. Ensure that the first Analysis Toolpak option is checked. Click OK to proceed.
- In the Data tab, click on the Data Analysis option.

- Scroll down the list of available Analysis Tools and select the Regression option. Click on OK to proceed.

- Provide the input Y range and input X range of the full model. Check the Labels option if your ranges contain the variable headers.
 After selecting the input, the user must also specify the output range where the tool should write the summary. Click on OK to proceed.
 - The Analysis Toolpak add-in will automatically perform multiple regression on the selected data.
- Repeat the previous four steps but instead use the independent variables that are present in the reduced model.

- We’ll note the Regression sum of squares of both summaries.

- Next, we must find the values of
p,n, andk.Prefers to the number of parameters that are not present in the nested model. Thenvariable refers to the number of total observations or simply the size of the dataset. Thekvariable is the number of coefficients found in the full model.

- We can find the F-test statistic by using the f-test formula seen below.

- Hit the Enter key to evaluate the F-test formula.

- We can find the P-value of our f-test statistic by using the
F.DIST.RTformula.
 Since our p-value is above the usual critical value of 0.05, we can conclude that there is no significant difference between our reduced and overall regression models.
These are all the steps you need to perform a partial F-test in Excel.
This guide should explain everything you need to know to perform your own partial F-test in Microsoft Excel.
We’ve explained how to use the Analysis Toolpak to find the regression sum of squares of both models being compared. You should now better understand the F-test statistic’s importance and how to interpret it.
Conducting a partial F-test is just one example of a statistical test you can perform in Excel. For example, we can also use Excel functions to perform a normality test on a given dataset. You can read our step-by-step guide on how to conduct a normality test to learn more.
You may also check our guide on how to perform multiple linear regression to analyze the relationship of a dependent variable with two or more independent variables.
That’s all for this guide on partial F-tests! If you’re still looking to learn more about Microsoft Excel, be sure to check out our library of Excel resources, tips, and tricks!