


When working with datasets, it might be useful to know how to normalize data in Google Sheets.
A normalized dataset is achieved when we scale the values to fit a particular range. It is useful in machine learning when working with features with vastly different ranges.
While there are many ways of normalizing data, one of the most common is finding the z-score. The z-score converts a number from its raw value to a number indicating its distance from the range’s mean. To find the z-score, we’ll have to compute the mean and the standard deviation of the population.
The z-score assumes that your data fits a normal distribution. The formula used to get the z-score is as follows:
z = (value – population mean) / population standard deviation
Standardizing helps compare values that have different units or have wildly different ranges. Many statistical analysis techniques use standardized data or assume that the data has already been normalized.
Let’s begin with a quick use-case of where we can use standardization.
Let’s consider a dataset that contains two features: age and annual income. The age attribute ranges from 0-100, while the income attribute can go as high as $1,000,000. If everyone in our dataset earns at least 5 figures annually, that means the income variable is a thousand times larger than the age.
If we perform a linear regression, the income variable will have a more significant effect on the outcome. We have to normalize the data so that each feature has the same range.
With the STANDARDIZE function, it becomes quite easy to return the normalized equivalent of any variable in a given range.
Another way we can scale a range is through min-max normalization. This involves scaling the ranges so that the minimum value is equal to 0 and the maximum value is equal to 1. This type of scaling is useful when you know that your data does not follow a normal distribution.
Let’s learn how to use the STANDARDIZE function to normalize data in Google Sheets and later test it out with an actual dataset.
A Real Example of Normalizing Data in Google Sheets
Let’s look at a real example of the STANDARDIZE function being used in a Google Sheets spreadsheet to normalize a dataset.
In the example below, we converted the table on the left-hand side to the normalized dataset seen on the right. The values in columns G and H use the same range of positive and negative standard deviations from the mean.
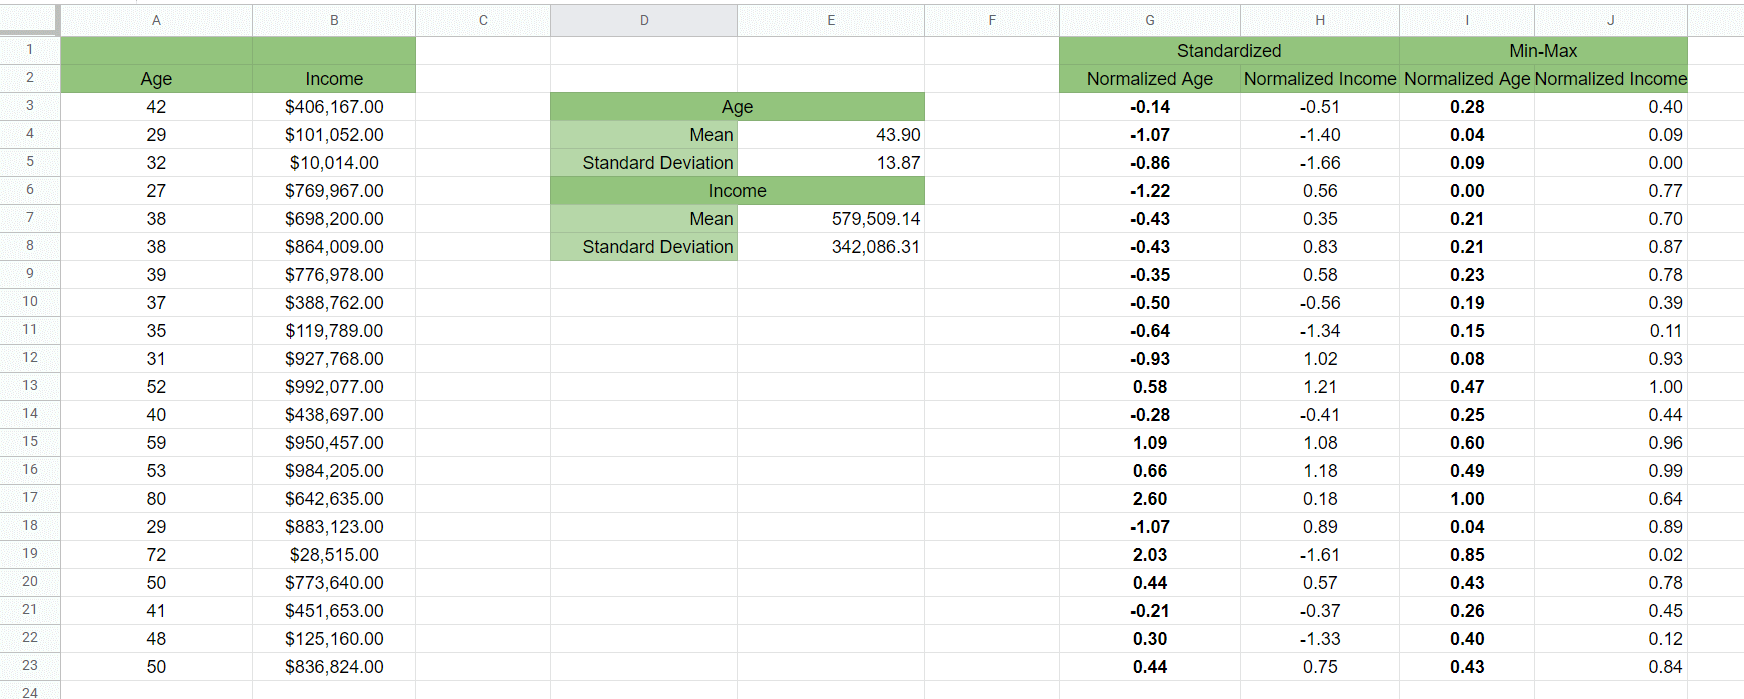
We also used the AVERAGE and STDEV functions to calculate the mean and standard deviation of each feature. These values are needed by the STANDARDIZE function.
If a certain data point has a positive normalized value, it means that the data point is greater than the mean. On the other hand, a negative normalized value indicates that the data point is less than the mean.
To get the range seen in Column G, we just need to use the following formula:
=STANDARDIZE(A2,$E$3,$E$4)
In the example below, we used min-max normalization to get a rescaled range of our age feature. The highest value in our range is now equal to 1, and our smallest value is equal to 0.

To get the min-max normalization, we used the following formula:
=(A2-MIN($A$2:$A$22))/(MAX($A$2:$A$22)-MIN($A$2:$A$22))
You can make a copy of the spreadsheet above using the link attached below.
If you’re ready to try out the normalization yourself in Google Sheets, let’s begin writing it step-by-step!
How to Normalize Data in Google Sheets
In this section, we will go through each step needed to start normalizing data in Google Sheets. This guide will show you how we could normalize the age range in the example shown in the last section.
Follow these simple steps to start using the STANDARDIZE function:
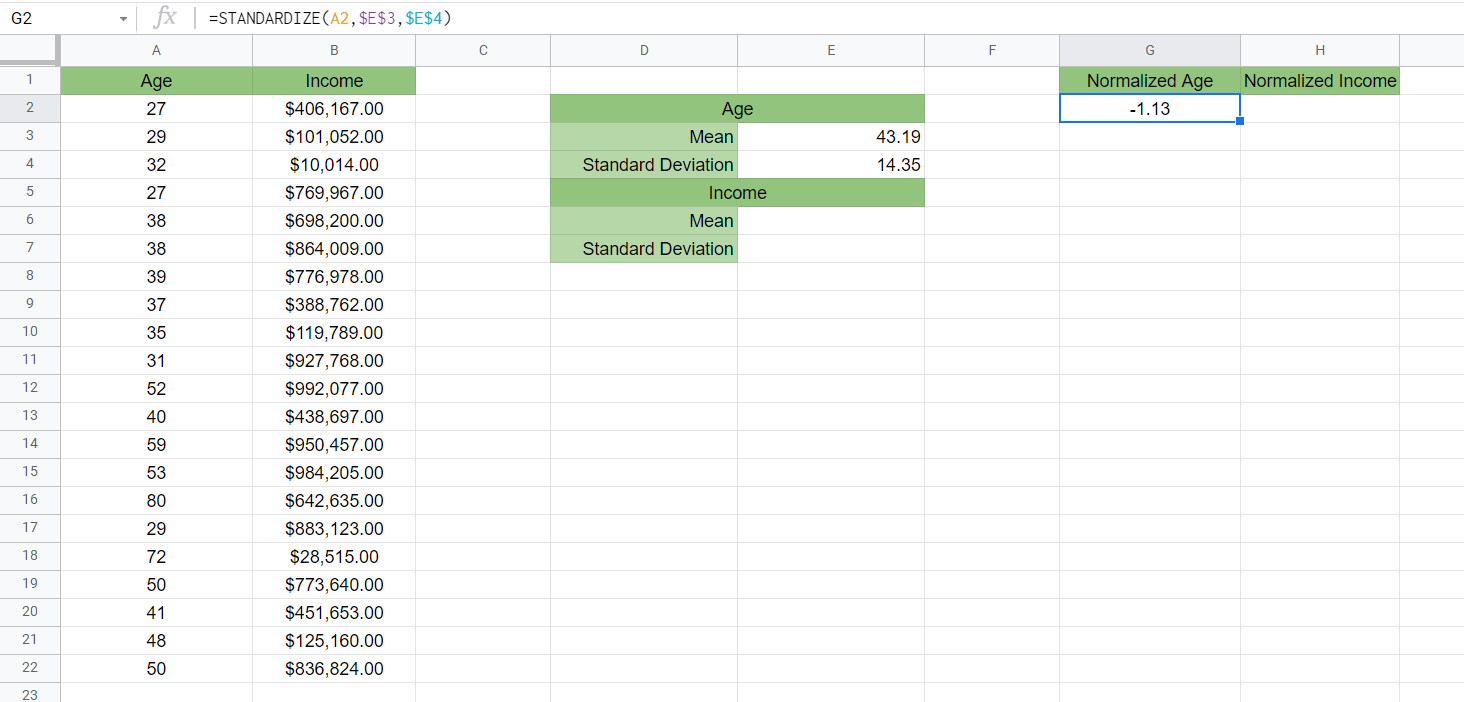
- First, let’s find the mean of the age feature. Using the
AVERAGEfunction, we find out that the mean is 43.19 years.

- Next, let’s use the
STDEVfunction to get the standard deviation of the age feature. In the example below, we were able to find a standard deviation of 14.35.

- After finding the mean and standard deviation of the feature to normalize, we can plug those values into the
STANDARDIZEfunction. We’ll first normalize the value in cell A2. After running through the function, the normalized value is -1.13.
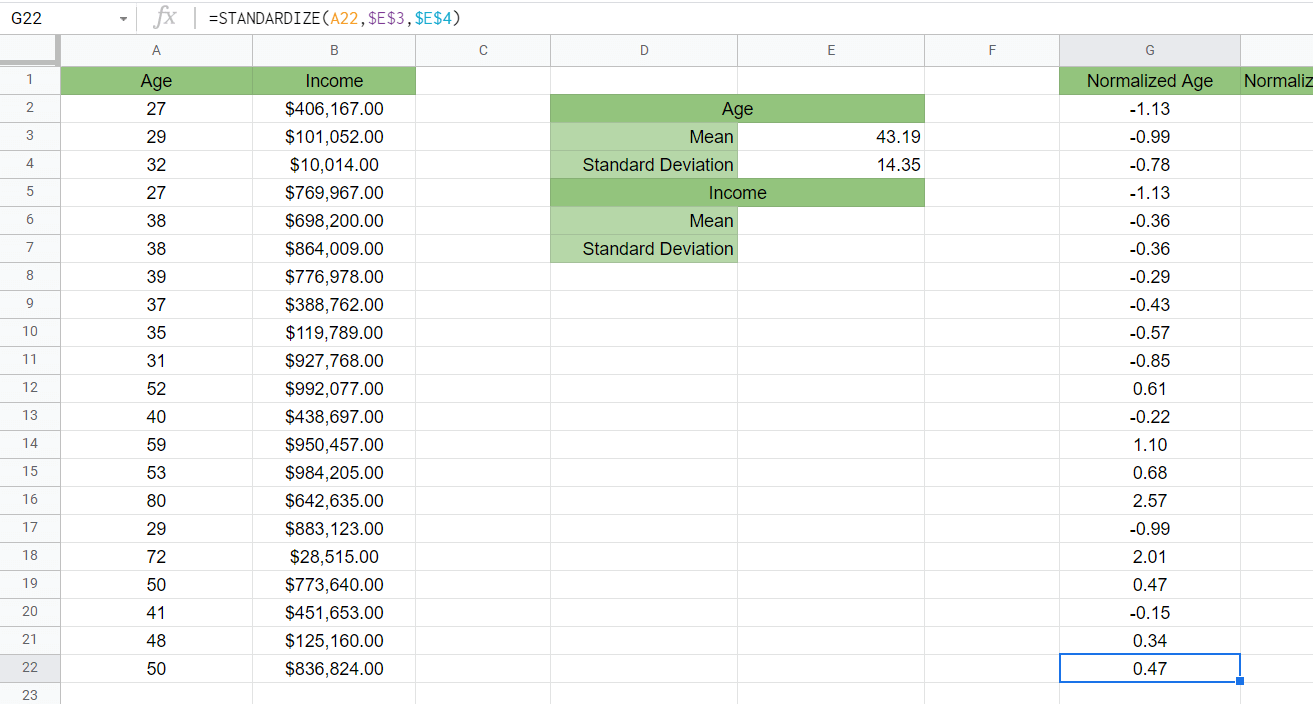
- Finally, we can normalize the rest of the range by dragging down the formula.
Frequently Asked Questions (FAQ)
- What’s the difference between standardization and scaling?
Scaling refers to transforming your data to fit a specific scale, such as 0-100 or 0-1. In standardization, you’re also scaling data, but the values are now centered around the mean. Each unit away from the mean refers to a single standard deviation away. - Why does my formula return an error?
Make sure that all the arguments of theSTANDARDIZEfunction are numeric. Non-numeric arguments will result in a#VALUE!error.
That’s all you need to know about normalizing data in Google Sheets. This step-by-step guide should make it easy for you to work with a dataset with features with wildly different ranges.
The STANDARDIZE function is just one example of a statistical function in Google Sheets. If you want to know more about the functions we used in this article, you can read up on our articles on the STDEV and AVERAGE functions.
With so many other Google Sheets functions out there, you can indeed find one that can help with your workflow.
Are you looking for more Google Sheets tips? Make sure to subscribe to our newsletter to be the first to know about the latest guides and tutorials from us.


