Read More How to Find a Line of Best Fit in Google SheetsbyDeion MenorJanuary 29, 2022 Finding a line of best fit in Google Sheets is useful when you want to visualize trends in… Read More
Read More How to Perform Polynomial Regression in Google SheetsbyDeion MenorJanuary 29, 2022 Performing polynomial regression in Google Sheets is useful when you need a more complex model of the relationship… Read More
Read More How to Perform Linear Regression in Google SheetsbyDeion MenorJanuary 29, 2022 The LINEST function in Google Sheets is useful when you need to perform linear regression on two or… Read More
Read More How to Calculate CAGR in Google SheetsbyDeion MenorJanuary 27, 2022 The CAGR or compound annual growth rate is a helpful metric in investment analysis that gives the real… Read More
Read More How to Find Outliers in Google SheetsbyDeion MenorJanuary 27, 2022 You might want to find outliers in Google Sheets when you’re analyzing or cleaning any dataset. Outliers affect… Read More
Read More How to Create a Radial Bar Chart in Google SheetsbyDeion MenorJanuary 22, 2022 The radial bar chart in Google Sheets is useful for creating eye-catching visualizations of differences among certain categories.… Read More
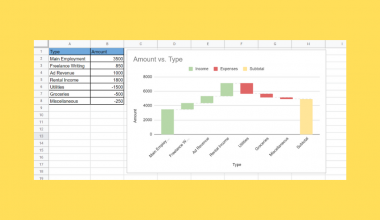
Read More How to Create a Waterfall Chart in Google SheetsbyDeion MenorJanuary 22, 2022 The waterfall chart in Google Sheets is helpful when you need to show how values add or subtract… Read More
Read More How to Add Error Bars to Charts in Google SheetsbyDeion MenorJanuary 21, 2022 It might be useful to know how to add error bars to charts in Google Sheets to capture… Read More
Read More How to Format Individual Data Points in Google SheetsbyDeion MenorJanuary 21, 2022 Let’s learn how to format individual data points in Google Sheets which may be useful to highlight certain… Read More
Read More How To Make a Boxplot in Google SheetsbyDeion MenorJanuary 21, 2022 The boxplot in Google Sheets is useful when you need to visualize the distribution of data in a… Read More