


This guide will help you understand how to perform a sign test in Excel.
The sign test can determine whether a population’s median equals a particular value.
The sign test is a non-parametric test that can test a claim about the population median against a hypothesized value k.
For each value in our dataset, we will assign a ‘+’ sign, a ‘-’ sign, or a 0. We will assign a ‘+’ sign to entries above k, and we’ll assign ‘-’ to entries lower than k. If the value is equal to k, we will return a value of 0.
If there is a significant difference between the number of ‘+’ signs and ‘-’ signs, then it is likely that the median is not equal to the hypothesized value of k.
Let’s take a look at a use case where we can perform the sign test in Excel.
Suppose you want to prove a claim that the median weight of a certain product is 255 grams. You randomly selected 100 units of that item for weighing.
How can we perform the sign test to determine whether we should reject this claim?
We can use a nested IF function to determine the sign of each value. After generating a sign for each value, we can use the COUNTIF function to count the number of positive and negative signs.
Afterward, the BINOM.DIST function will help us find the sign test’s p-value.
Now that we know when to use the sign test, let’s learn how to use it on an actual sample dataset.
A Real Example of Using the Sign Test in Excel
The following section provides several examples of how to perform the sign test in Excel. We will also explain the formulas and tools used in these examples.
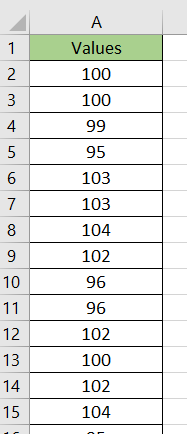
First, let’s look at our sample data. We have a list of weight measurements from randomly-selected units of a particular product. We want to use these weights to determine whether the median weight of the product is equal to 100g.
We’ll use a custom formula to conduct the sign test on the given dataset. After finding the corresponding sign of each value, we’ll count the number of positive and negative signs.

If the number of positive and negative signs is very close, then it could mean that our proposed median weight may be the actual median weight of the entire population.
We’ll use the BINOM.DIST function to return the p-value of our sign test. A p-value lower than 0.05 will indicate that our sign test is reliable.
Do you want to take a closer look at our examples? You can make your own copy of the spreadsheet above using the link attached below.
If you’re ready to perform a sign test in Excel, head over to the next section to read our step-by-step breakdown on how to do it!
How to Perform a Sign Test in Excel
This section will guide you through each step needed to perform a sign test in Excel. You’ll learn how we can use a custom formula to determine the sign of each value in our dataset, given a particular mean. Next, we’ll use these signs to determine whether the population median is equal to a certain value.
Follow these steps to start using the sign test in Excel:
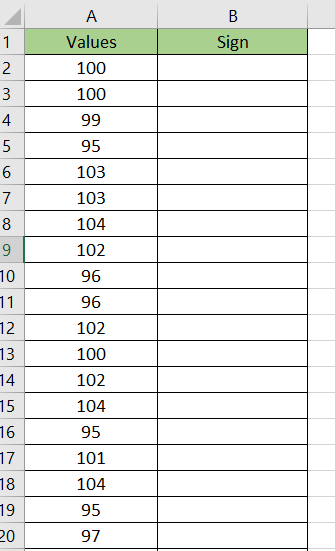
- First, create a new column labeled ‘Sign’.
- We’ll use the IF function in our custom formula to check if the current value is less than, greater than, or equal to some value. Our first argument will check if the cell A2 is less than our chosen value of 100. If this condition is met, the formula will return ‘-1’.

- If our current value is not less than 100, we’ll check if the value is equal to 100. The formula returns ‘0’ if the value is equal to 100 and ‘1’ if the value is greater.

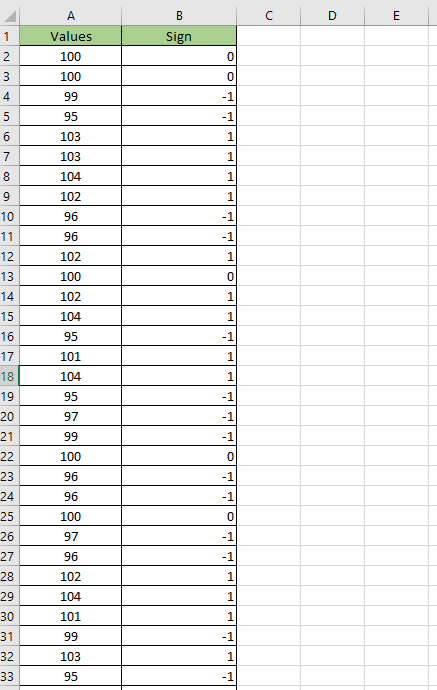
- Hit the Enter key to evaluate the function. In this example, our formula returns ‘0’ since the value in A2 is equal to our chosen value.

- Use the Fill Handle tool to return the sign of the rest of the dataset.
- Next, we’ll use the
COUNTIFfunction to count how many positive signs were generated by our sign test.

- We will also use the
COUNTIFfunction to determine the number of negative signs generated by the sign test.
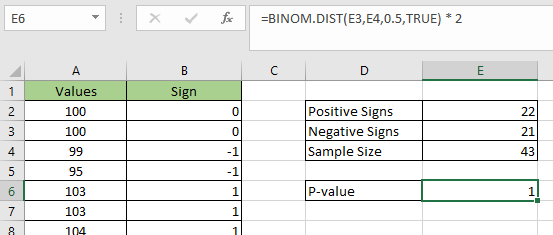
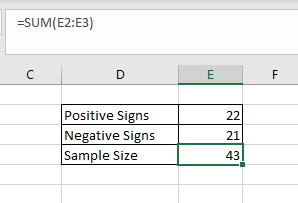
- The sample size is equal to the number of positive and negative signs combined.
- We’ll use the
BINOM.DISTfunction to determine the p-value of our sign test. If the p-value is not less than 0.05, we fail to reject the null hypothesis.
These are all the steps needed to perform a sign test in Excel.
This step-by-step guide should help you perform a sign test in Excel yourself.
You can use the sign test to determine whether a claim about a population’s median can be rejected or not.
The sign test is just one example of the many statistical methods you can perform on an Excel spreadsheet. Our website offers hundreds of other functions and methods to help you get more out of Microsoft Excel.
With so many other Excel functions available, you can find one appropriate for your use case.
Don’t miss out on our team’s new spreadsheet tips, tricks, and best practices. Subscribe to our newsletter to stay updated on the latest guides from us!


