

This guide will explain how to use Copilot in Excel as a smart AI assistant for your spreadsheet workflow.
Table of Contents
Microsoft Copilot is an AI-powered digital assistant that has recently been integrated into several Microsoft services including Microsoft Excel.
Copilot can help explore, understand, and visualize your data by talking to the assistant through a chat interface. The AI assistant can even help generate formulas for your worksheet and can highlight, filter and sort your data with a few simple prompts.
In this guide, we will provide a step-by-step tutorial on how to access Copilot and use it for a variety of Excel tasks.
A Real Example of Using Copilot in Excel
Let’s explore a simple example where we can use Copilot in Excel to analyze spreadsheet data.
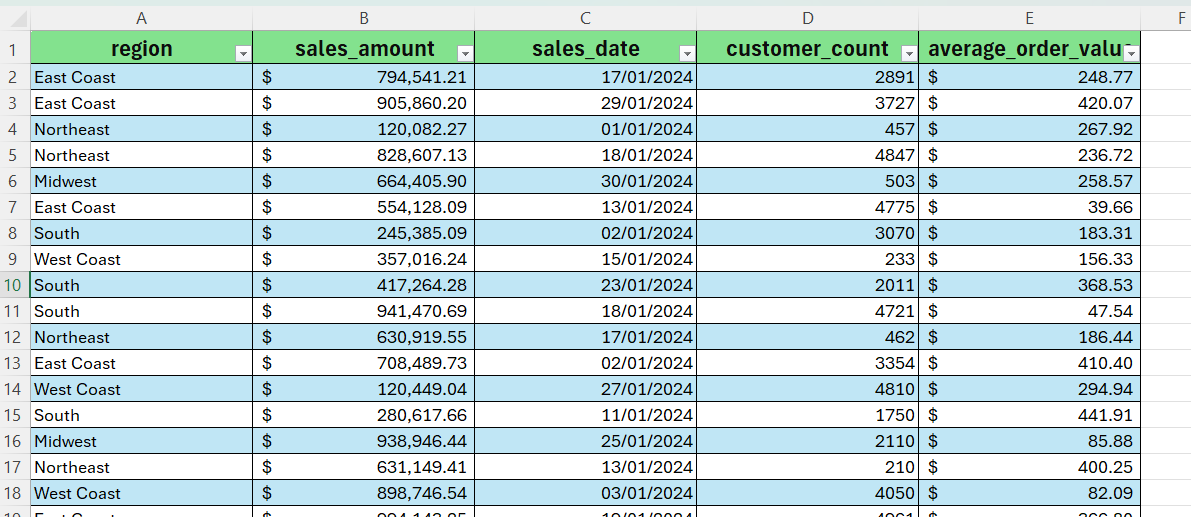
In the table above, we have a spreadsheet containing regional sales data for a certain retail corporation. We’ve converted our data into an Excel table to ensure that our dataset is readable by Copilot.
If you prefer to keep your data in a range and not converted as an Excel table, users must ensure that the dataset follows these criteria:
- Only one header row
- Headers are only on columns, not on rows
- Headers are unique; no duplicate headers
- No blank headers
- Data is formatted in a consistent way
- No subtotals
- No empty rows or columns
- No merged cells
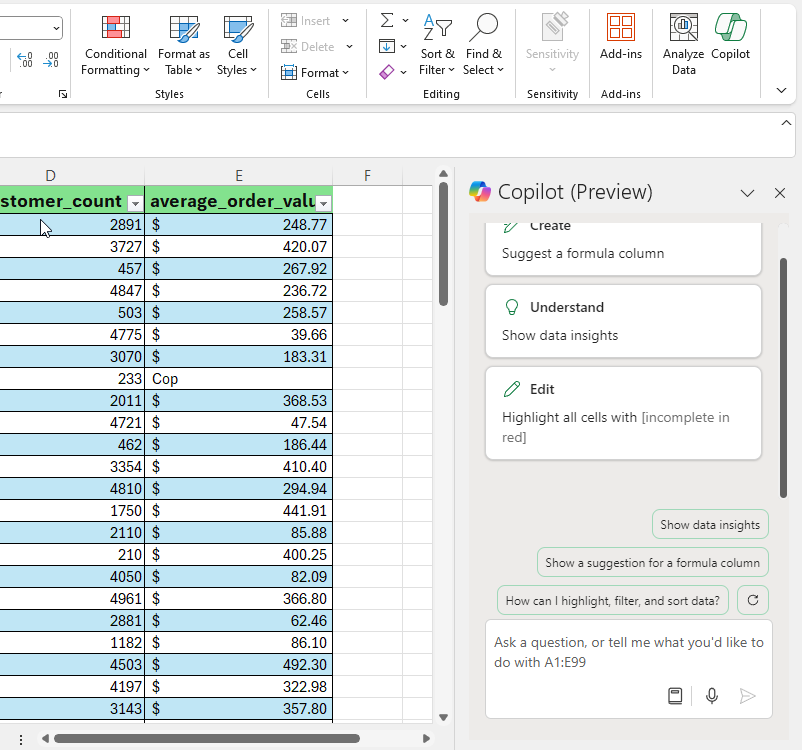
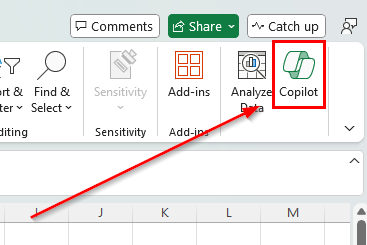
After setting up our data, we can now click Home > Copilot to access the Copilot side panel.
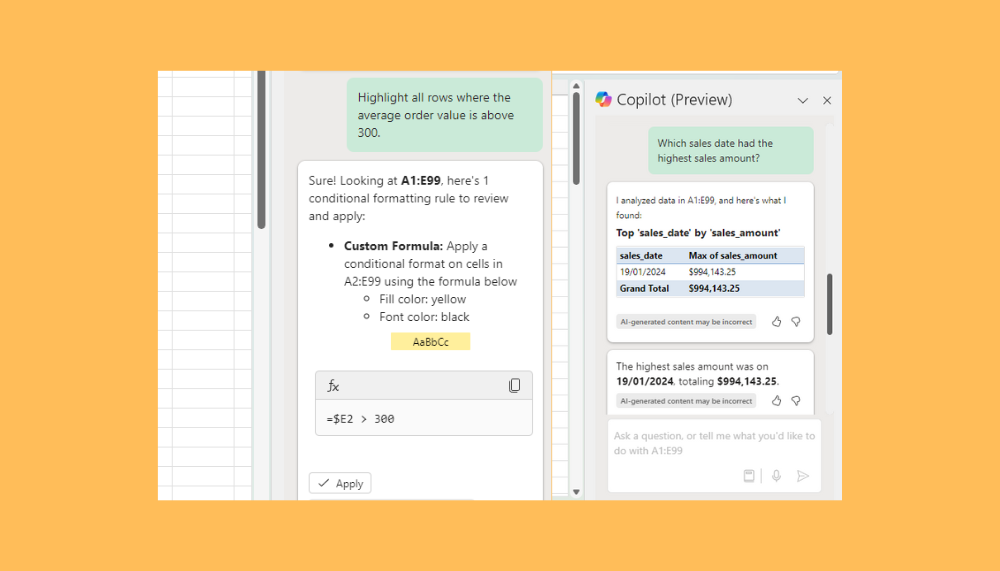
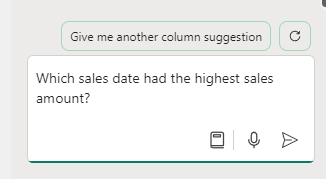
The side panel will include a textbox at the bottom where users can send prompts to Copilot. For example, we can send the following prompt to determine the date with the highest sales in our dataset:
Which sales date had the highest sales amount?

Copilot will take a few seconds to interpret your prompt and reply with a potential answer to your query. Do note that Copilot’s technology is still improving and may return incorrect or inaccurate data. Because of this, we recommend double-checking Copilot’s results with your own analysis.
Click on the link below to create your own copy of our examples.
Head to the next section to read our step-by-step tutorial on how to add comments within a Google Sheets formula.
How to Use Copilot in Excel
- First, open the Excel document containing the data you want to explore with Copilot. Do note that the Excel document must be backed up in the cloud since Copilot only works on files stored in OneDrive or SharePoint.
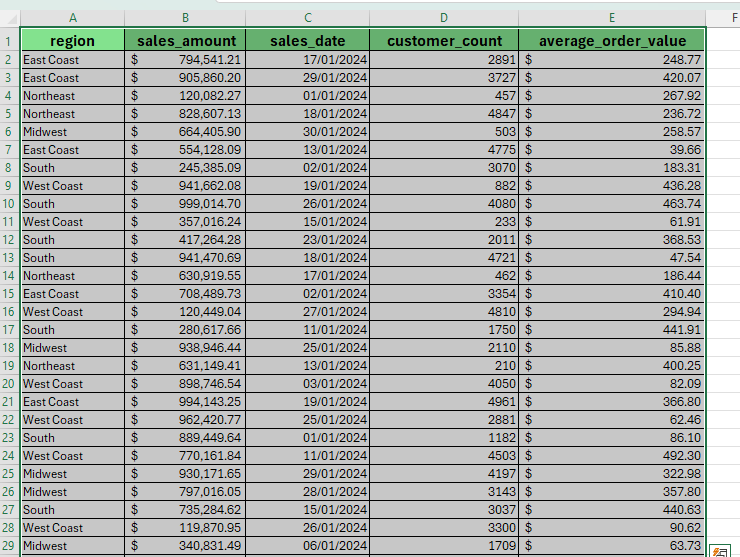
Select the cell range containing your data. Click Insert > Table to convert the current range into an Excel table.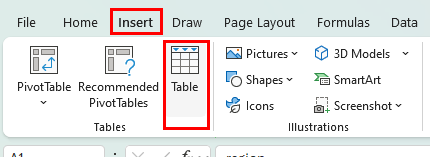
Check the My table has headers option if applicable then click OK.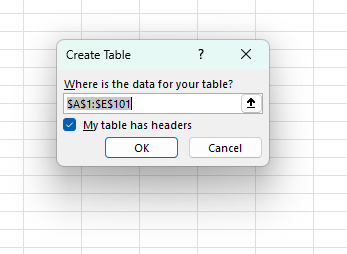
Your data should now be formatted as an Excel table.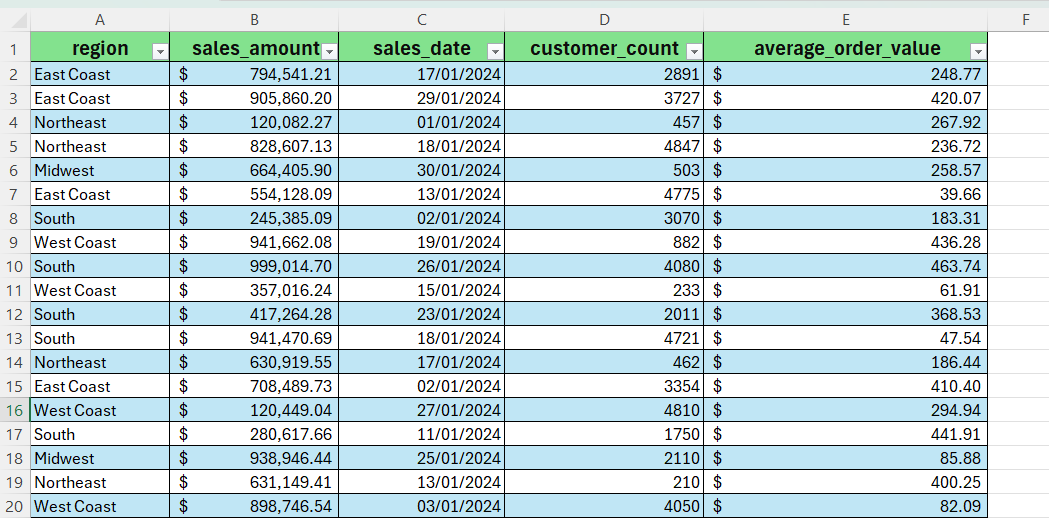
- In the Home tab, select the Copilot option.
You should now see a panel on the right side of your Excel program.
- Place your cursor on the prompt input box and start typing your prompt. For this example, let’s try to ask the Copilot to determine the sales date with the highest sales amount value.
After a few seconds, Copilot will reply with an answer for that prompt.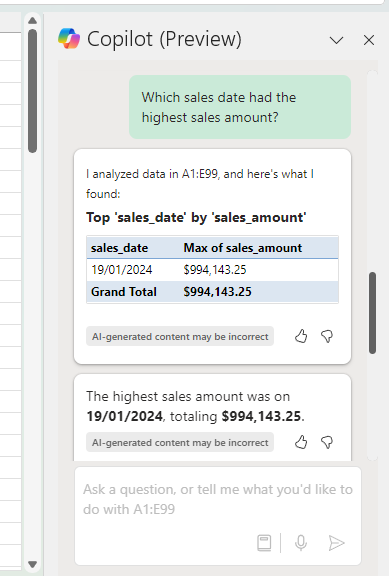
- Copilot can also highlight, sort, and filter your Excel tables. For this example, let’s try highlighting all rows where the average order value is above $300.
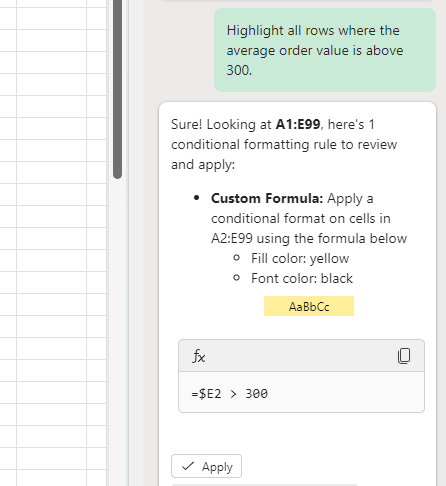
After sending the prompt, Copilot will reply with a custom formula which can be applied as a conditional formatting rule. Click on Apply to add that rule to the Excel table data.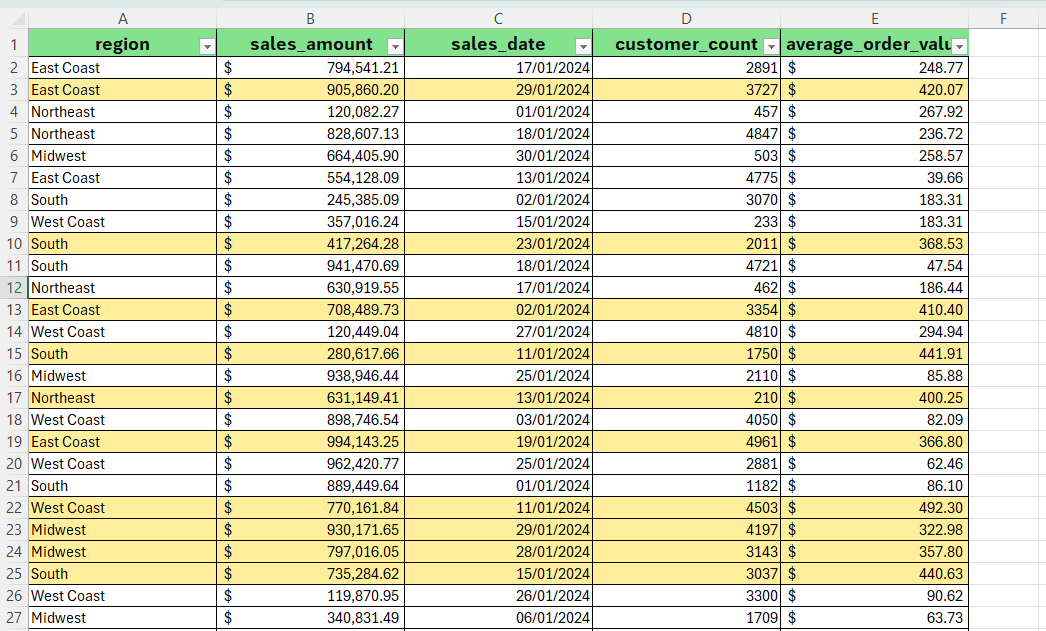
To learn more about analyzing data in Excel, you can read our post on how to use ChatGPT to create new formulas in Excel.
That’s all for this guide! Don’t forget to check out our library of spreadsheet resources, tips, and tricks for both Google Sheets and Microsoft Excel!


