


The VARPA function in Google Sheets is useful when you need to calculate variance based on an entire population.
This function takes the sum of the squares of each value’s deviation from the mean and divides it by the number of such values.
The rules for using the VARPA function in Google Sheets are as follows:
- The function requires at least two data points to be entered as arguments. These values can be cell references, numerical values, or ranges.
- The function then outputs the variance of the provided values.
First, let’s understand what we mean by population variance.
Variance refers to the numerical value that describes the distribution of data points from the mean. For example, a variance of 0 means that all data points are equal to the mean. Having a greater variance means that values are more spread out.
Population variance follows the formula Σ(xi-x-)/n where n is the number of items. The sample variance is similar, but it subtracts 1 from the denominator n. In other words, the variance is the average distance from each data point in the population to the mean squared.
Let’s say we have a dataset of employee output. In this example, output refers to the number of reports they could write in a month. Let’s say we have two teams, the marketing team and the sales team. We want to know the average work output of each team, and the population variance. A high population variance might mean that the team’s productivity is not very consistent.
With the VARPA function, we can easily find this out. We just need to input the range of values that correspond to the number of reports per month for each team. We’ll look at an example of how to do this in a later section.
This use case is just one use case for the VARPA function in Google Sheets. The variance calculation can also help in the fields of social studies, finance, and the natural sciences.
Now that we have an idea of when to use the VARPA function, let’s look into how to write the function out.
The Anatomy of the VARPA Function
The syntax of the VARPA function is as follows:
=VARPA(value1, [value2, ...])
Let’s look at each term to understand what they mean.
- We use the equal sign “=” to start any type of function in Google Sheets.
- VARPA() is our
VARPAfunction. It calculates the variance based on an entire population. - value1 refers to the first value or range of the population.
- value2 refers to the additional values or ranges to include in the population.
- The
VARPAfunction supports an arbitrary number of arguments. - Remember that we use
VARPAwhen we’re handling an entire population. If you’re working with a sample, you may want to use theVARAfunction instead.
A Real Example of Using VARPA Function
Let’s look at an actual example of the VARPA function being used in a Google Sheets spreadsheet.
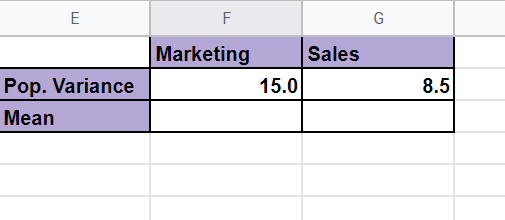
In the table below, we have a list of employees, the teams they belong to, and their work output for the month. Using the AVERAGE function, we discover that both teams have about the same average output per member. However, when you see the population variance, we notice that the performance of the sales team is much more consistent while the marketing team’s performance is more spread out.
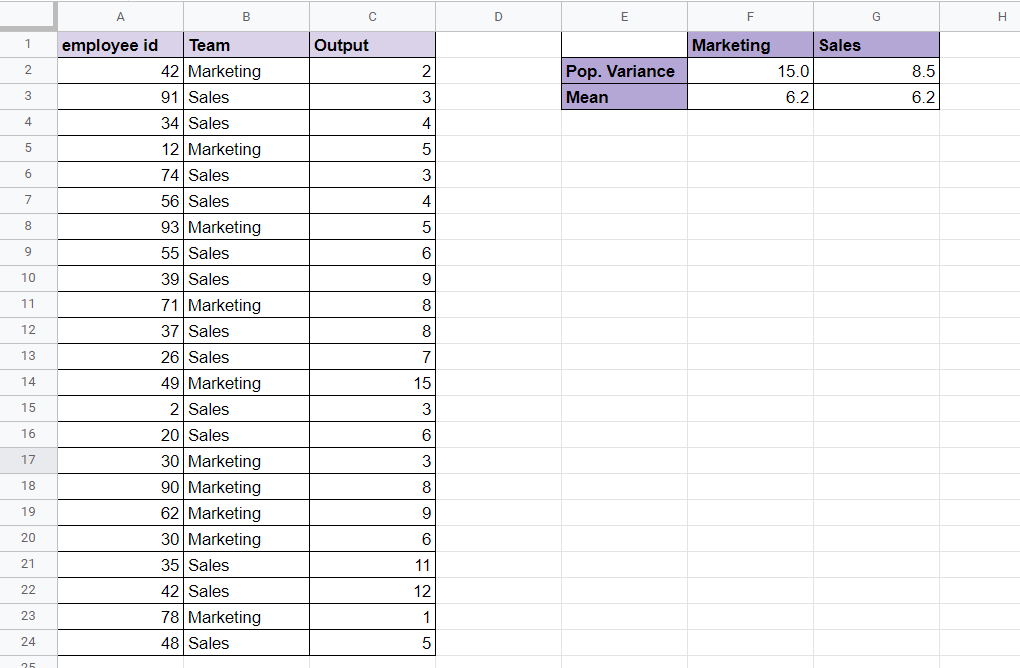
To get the value in cell F2, we just need to use the following formula:
=VARPA(FILTER(C2:C24,B2:B24=F1))
You can make your own copy of the worksheet above using the link attached below.
If you’re ready to try out the VARPA function in Google Sheets, let’s begin writing it ourselves!
How to Use VARPA Function in Google Sheets
In this section, we will go through each step needed to start using the VARPA function in Google Sheets. This guide will show you how to get the population variance of a dataset using the employee data shown earlier.
Follow these steps to start using the VARPA function:
- First, select the cell which will hold the result of our
VARPAfunction.

- Afterward, we just have to type the equal sign ‘=‘ to begin the function, followed by ‘VARPA(‘.
- You might see a tooltip box with tips on how to use the
VARPAfunction. Clicking on the arrow on the top-right-hand corner of the box will hide it if needed.

- Next, we need to specify the range to find the variance. We use the
FILTERfunction to get the work output in rows where the team is “Sales”.

Afterward, we can hit Enter on the keyboard to let the function evaluate.
Now we know the variance in productivity of each team when it comes to reports.
Frequently Asked Questions (FAQ)
- How does the VARPA function compute its result?
TheVARPAfunction takes the sum of the squares of each value’s deviation from the mean and divides by the number of such values. - Why does my formula return an error?
The dataset should contain at least two numbers. If the total number of values is less than two,VARPAwill return a#DIV/0!error. - What happens when my dataset has text values?
TheVARPAfunction considers all text values as 0 when computing for variance. If you want text values to return an error, you can use theVARAfunction instead.
That’s all you need to know to start using the VARPA function in Google Sheets. It’s quite easy to get the population variance of a dataset.
The VARPA function is just one example of a statistical function you can use in Google Sheets. With so many other Google Sheets functions out there, you can surely find one that helps with your computations.
Stay notified of new guides like this by subscribing to our Google Sheets newsletter!


