This guide will discuss how to use MARGINOFERRORfunction in Google Sheets.
When we want to determine if there are errors in collecting data, we can easily do it by using the MARGINOFERROR function in Google Sheets.
The rules for using the MARGINOFERROR function in Google Sheets are the following:
- The
MARGINOFERRORfunction calculates the margin of error from a given range of values and a confidence level. - When the sample size is greater, the margin of error decreases.
- We can utilize the
MARGINOFERRORfunction for continuous data that is usually distributed. - Additionally, using the
MARGINOFERRORfunction for data sets with large sample sizes is more appropriate.
We used to need several functions to calculate the margin of error in Google Sheets but now we can efficiently do this using the MARGINOFERROR function.
The margin of error is used to identify the amount of error due to chance in a random sample of a population. It tells us how accurate our data collection is.
In this guide, we will provide a step-by-step tutorial on how to use the MARGINOFERROR function in Google Sheets. Additionally, we will explore the syntax and a real example of using the function.
Great! Let’s dive right in.
The Anatomy of the MARGINOFERROR Function
The syntax or the way we write the MARGINOFERROR function is as follows:
=MARGINOFERROR(range,confidence)
- = the equal sign is how we start any function in Google Sheets.
- MARGINOFERROR() is our
MARGINOFERRORfunction. This function calculates the margin of error from a given range of data and a confidence level. - range is a required argument. This refers to the range of values we want to use to calculate the margin of error.
- confidence is another required argument. This refers to the desired confidence level between 0 and 1. For instance, the commonly used confidence levels are 0.90, 0.95, and 0.99.
Understanding the Margin of Error
A large margin of error suggests that the estimate based on a specific sample may not accurately reflect the parameter of the entire population. We want to ensure that our data set has a small margin of error.
For example, the margin of error decreases when the sample size is greater. Additionally, ranges with fewer differences among values also have smaller margins of error.
Another important aspect of calculating the margin of error is the confidence level. The confidence level is the likelihood that the true mean of the population or range lies in the margin of error above or below the sample mean.
In simpler terms, the confidence level tells us how confident we are that the range of values is a good representation of the true population. The most frequently used confidence levels are 0.90, 0.95, and 0.99.
Higher confidence levels, such as 0.99, provide greater certainty but result in wider confidence intervals (larger margin of error). Conversely, lower confidence levels, such as 0.90, provide less certainty but result in narrower intervals (smaller margin of error).
A Real Example of Using MARGINOFERROR Function in Google Sheets
Let’s say we have a data set of the average student’s average grade in a sample. Our initial data set would look like this:

In the spreadsheet above, we can see the names of each student and their average grade. In this example, we want to determine the margin of error in the range of values.
Previously, we would have to perform a series of calculations before determining the margin of error. For instance, we would need to use the AVERAGE function, the STDEV function, the NORM.S.INV function, and the COUNTA function to calculate the margin of error in a range.
Now we can simply use the MARGINOFERROR function to measure the number of errors in a given range of values.
We can get the margin of error using the formula:
=MARGINOFERROR(B2:B11,0.9)

First, we will simply select the range containing the values we want to use to calculate the margin of error. In this formula, our range argument is B2: B11.
Next, we will input our desired confidence level between 0 and 1. In this case, we want a confidence value of 0.90 to provide a smaller margin of error.
Afterward, we can calculate our confidence interval, which provides a range of values within what we believe is the true average value for the entire population.
To do this, we will simply add the margin of error to the mean to get the upper bound. Then, we will subtract the margin of error from the mean to get the lower bound.
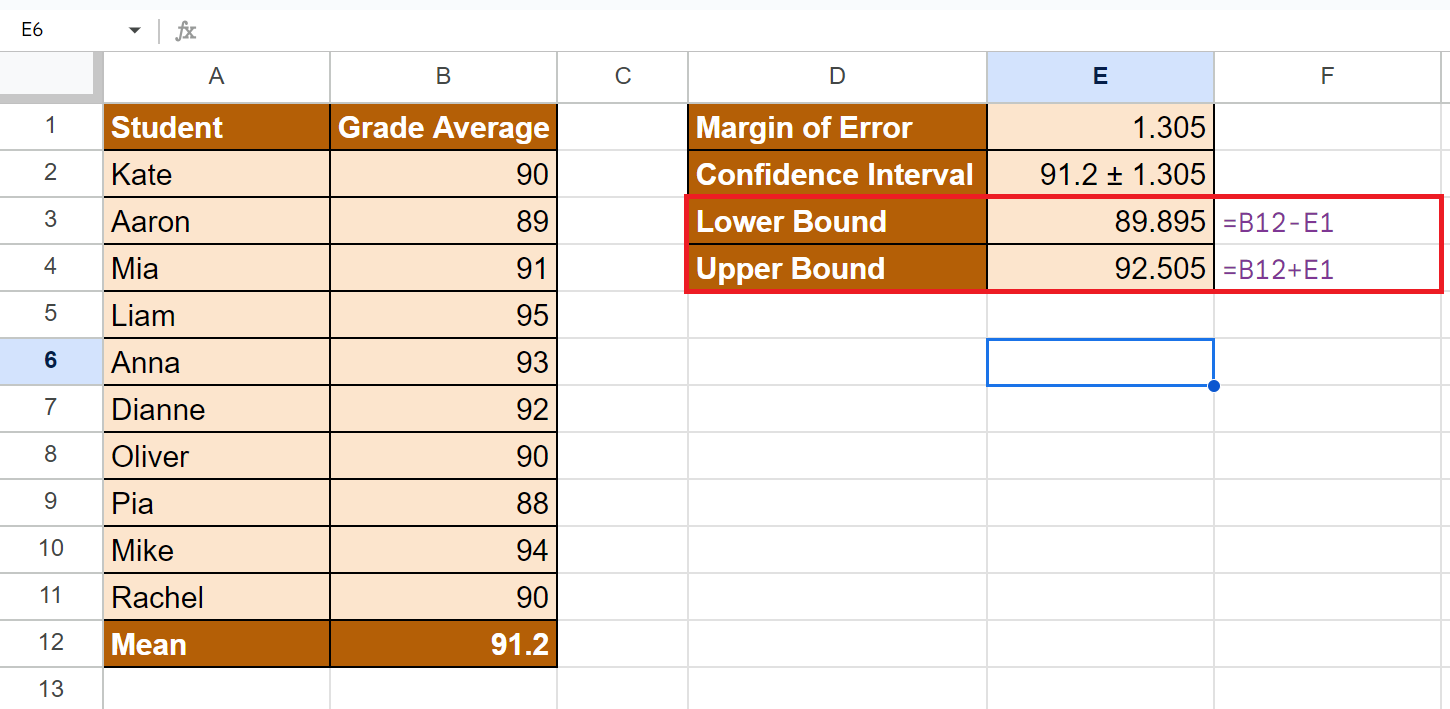
Our final data set would look like this:

You can make your own copy of the spreadsheet above using the link below.
Amazing! Now we can dive into the steps of using the MARGINOFERROR function in Google Sheets.
How to Use MARGINOFERROR Function in Google Sheets
1. First, we will choose an empty cell to input our result. Then, we will start with an equal sign and the function name. This will give us the starting formula “=MARGINOFERROR(“.

2. Next, we will simply select the range containing all the values. In this case, the values are in the range B2:B11. Our formula would become “=MARGINOFERROR(B2:B11”.

3. We will type in our desired confidence level, which is 0.90. Our final formula would be “=MARGINOFERROR(B2:B11,0.90)”. We will press the Enter key to return the result.
4. Lastly, we can calculate the confidence intervals starting with the lower bound. To do this, we will subtract our margin of error from the mean. Our formula would be “=B12-E1”.

5. Then, we can calculate the upper bound by adding the margin of our error to the mean. In this case, our formula would be “=B12+E1”.
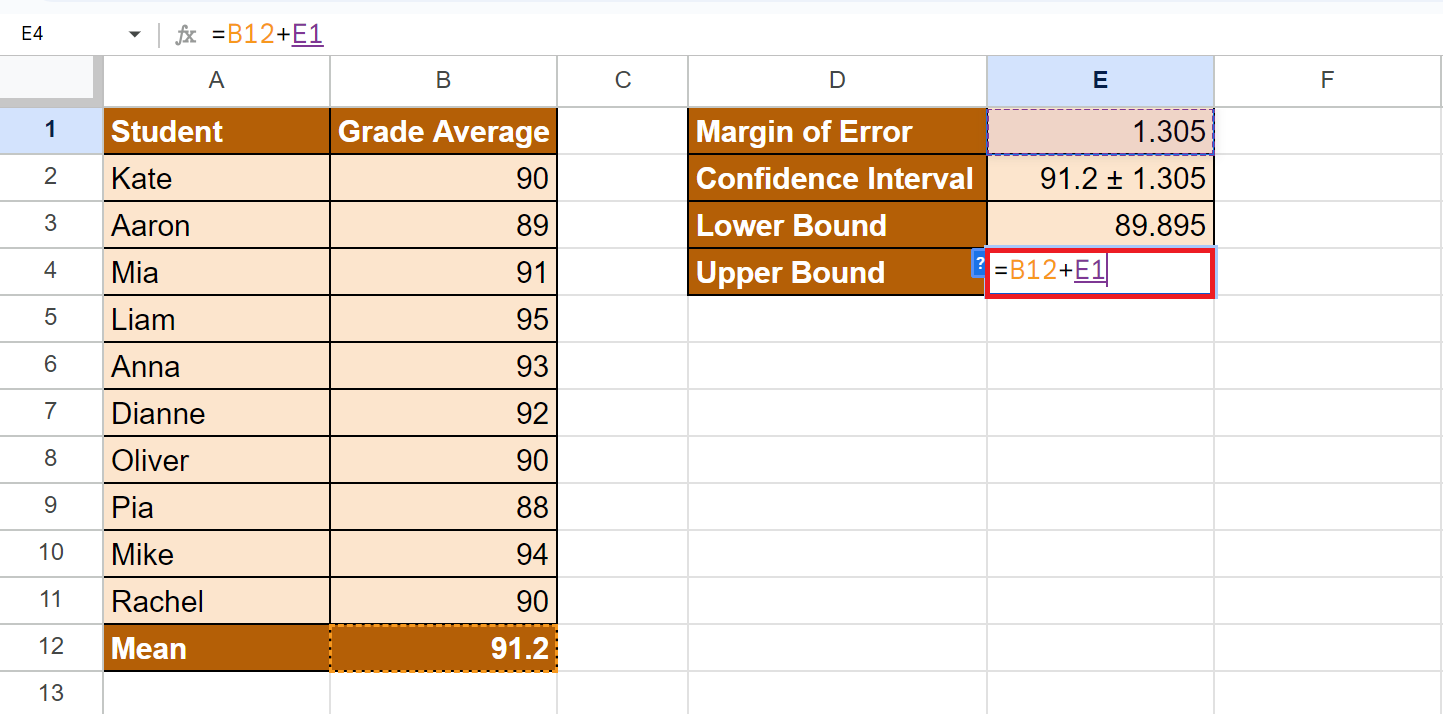
And tada! We have successfully used the MARGINOFERROR function in Google Sheets.
You can apply this guide whenever you need to quickly calculate the margin of error of a given range. You can now use the MARGINOFERROR function and the various other Google Sheets formulas available to create great worksheets that work for you.
FAQs:
1. How to interpret the margin of error result?
The margin of error measures if errors occurred in the data collection. When the margin of error is lower, the data is more accurate. When it is higher, the data is less accurate.
2. How to interpret the confidence intervals?
The confidence interval gives us a range of what we believe is the true representation of the entire population. In our example above, we have a confidence interval of 91.2 ± 1.305.
This means that we are 90% confident that the true grade average of the entire student population is within the range of 89.895 to 92.505.
3. How to choose the correct confident level?
Higher confidence levels provide a greater level of confidence but a larger margin of error. Conversely, lower confidence levels provide less confidence but a smaller margin of error.
It’s worth noting that other confidence levels can also be chosen based on specific requirements or conventions in different fields of study. The choice of confidence level depends on the desired balance between precision and certainty.
That’s pretty much it! Make sure to subscribe to our newsletter to be the first to know about the latest guides and tutorials from us.