The CORREL function in Google Sheets is helpful when you need to compute the Pearson product-moment correlation coefficient of a dataset.
The Pearson product-moment correlation coefficient (also known as r) measures the strength of the linear association between two variables. You can use this function to find out whether two variables have some sort of relationship.
The rules for using the CORREL function in Google Sheets are as follows:
- The function requires two arguments. These arguments include two sets of independent and dependent variables.
- The function then returns the correlation between the two given sets.
For example, let’s say we have weather data as well as data on how many people visit the local beach. You are tasked to find out whether there is a significant correlation between the temperature on a certain day and how crowded the beach is on that day.
With the CORREL function, we can get a numerical value which can tell us whether there is a positive or negative correlation. We can also determine whether no significant correlation is present. Correlations range from -1 to 1, with greater absolute value meaning there is a stronger correlation.
Positive correlations imply that a higher measurement in one dataset leads to a higher measurement in the other dataset.
This use case is just one possible to use the function in Google Sheets. We can find correlations in medical data, financial markets, or any numerical dataset available. In the next section, we’ll learn how to write the CORREL function ourselves in Google Sheets and later test out the function with an actual dataset.
The Anatomy of the CORREL Function
The syntax of the CORREL function is as follows:
=CORREL(data_y, data_x)
Let’s dissect this thing and understand what each of these terms means:
- = the equal sign is how we start any function in Google Sheets.
- CORREL() is our
CORRELfunction. It computes the Pearson product-moment correlation coefficient of a dataset. - data_y refers to the range representing the array or matrix of dependent data.
- data_x refers to the range representing the array or matrix of independent data.
- Text encountered in the arguments is to be ignored.
A Real Example of Using CORREL Function
Let’s look into an example of the CORREL function being used in a Google Sheet spreadsheet.
In the example below, we have a dataset with two columns A and B. Using a scatter plot, we can see that there is clearly a positive correlation between the values. Using the CORREL function, we can quantify that they have a positive correlation of ~0.948.
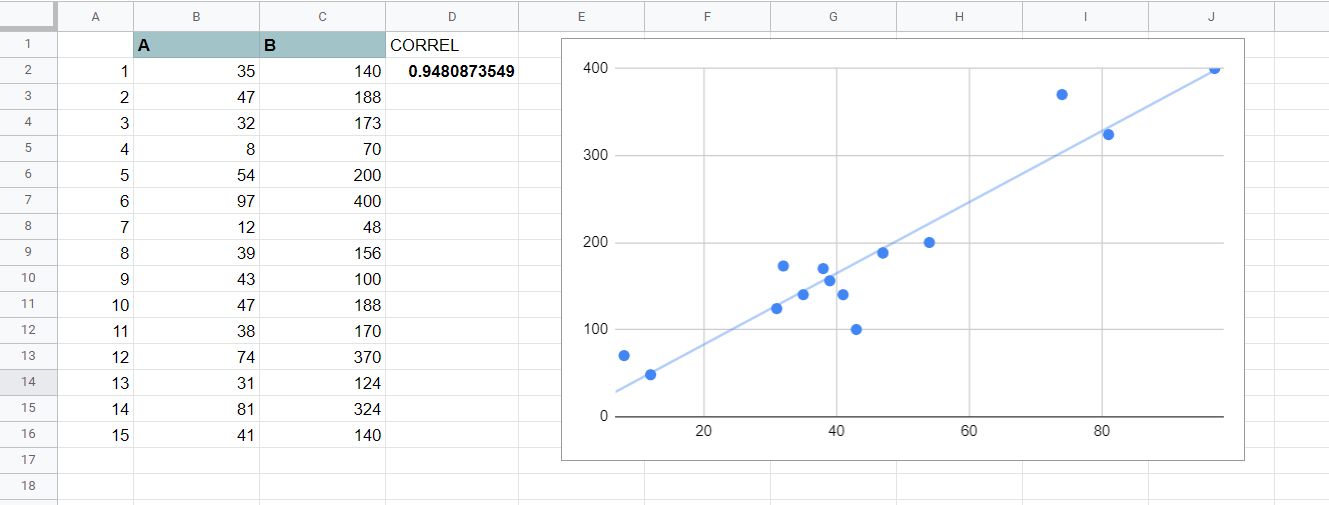
To get the value in Column D2, we just need to use the following formula:
=CORREL(B2:B16,C2:C16)
You can make a copy of the spreadsheet above using the link I have attached below.
In the second example below, we used =RANDBETWEEN(1,1000) to generate columns A and B in our dataset. We can see that there is a less significant correlation of -0.224. This is expected, considering we generated these values at random.

If you’re ready to start using the CORREL function in Google Sheets, let’s try setting it up ourselves!
How to Use CORREL Function in Google Sheets
- We first need to select the cell to place the result of our
CORRELfunction. In this example, we’ll place the result in cell B18, below our dataset.
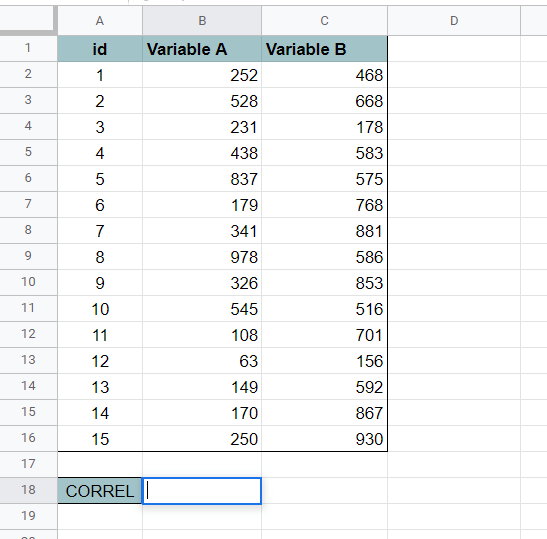
- Next, we need to type the equal sign ‘=‘ to begin the function, followed by the name of our function.
- After typing out the name of your function, a tooltip box may appear. We can click on the arrow found at the top-right-hand corner of the box to minimize it.

- The next step is to type in our arguments. Since we want to find the correlation between the two columns, our arguments are B2:B16 and C2:C16
Afterward, simply hit Enter on your keyboard to let the function evaluate.

In this example, the correlation between the two variables is 0.02, which implies that there is no significant correlation between them.
Frequently Asked Questions (FAQ)
- Why does my formula return a #N/A error?
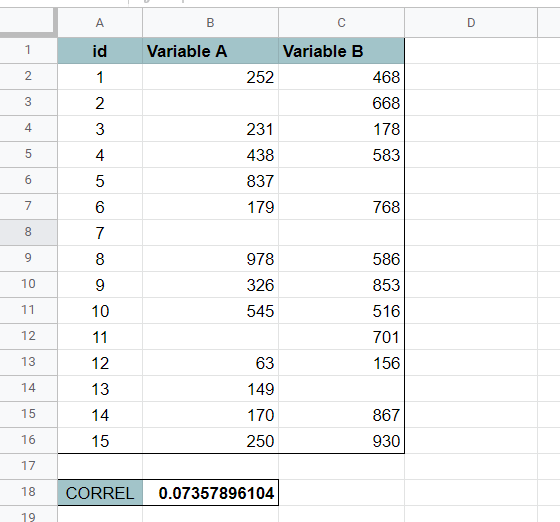
Make sure that the arguments are of the same length. If the ranges provided have a different number of data points, theCORRELfunction will return an #N/A error. - What happens if either of my datasets have missing values?
TheCORRELfunction will ignore empty cells. In the example below, rows 3 and 6 are ignored from the calculation. The function will work as intended as long as the ranges are of equal length and have numerical values.
That’s all you need to understand to start using the CORREL function in Google Sheets. With Google Sheets, it’s much easier to find correlations between datasets without having to perform complex calculations.
You can now use the CORREL functions in Google Sheets together with the various other Google Sheets formulas available to create great worksheets for any type of analysis.
Consider subscribing to our newsletter to be the first to know about the latest Google Sheets guides and tutorials from us.