This guide will discuss how to create an entity relationship diagram in Excel using the Insert Shapes feature.
An entity relationship diagram is one type of flowchart that displays how entities are related or connected to one another in an organizational structure or within a system. For example, entities can be people, objects, or even concepts.
So an entity relationship diagram in Excel refers to a visual representation or model of a database schema. Essentially, it displays your tables containing data as boxes with lines connecting to other boxes to represent the relationship between them.
And there are many tools that we can use to create an entity relationship diagram. But, we will learn how to create an entity relationship diagram in Excel using the Insert Shapes feature.
Let’s take a sample scenario.
Suppose you are working on an inventory report. And your worksheet contains too many tables. So you want to create an entity relationship diagram to display the relationship among the tables. Furthermore, it will be easy for other people to understand how each table relates to one another.
Great! Let’s dive into a real example of creating an entity relationship diagram in Excel.
A Real Example of Creating Entity Relationship Diagram in Excel
Before we can begin creating an entity relationship diagram, we need to prepare the components needed to create one. So there are three components in creating an entity relationship diagram.
Firstly, we have entities that can be any unit, people, object, place, or item within a database with a separate and distinct identity. And these are represented by rectangular boxes in the entity relationship diagram.
Secondly, we need to have attributes. So attributes describe the entities or tables. More specifically, attributes refer to the properties of the entities. And entities must have attributes.
Lastly, we must have relationships. A relationship refers to the connection of the entities or how each entity is linked to one another. So relationships describe how many attributes an entity can relate to or link to how many attributes of another entity.
Furthermore, there are several ways relationships are expressed in an entity relationship diagram. For example, one relationship is represented by one vertical line. And only-one relationship is displayed as two vertical lines.
You may refer to the table below to better understand this.

After preparing all three components, we can now begin creating an entity relationship diagram in Excel.
In this case, we will utilize the Insert Shapes feature in Excel to create our diagram. Once we have prepared our database, we will then create our entities. Then, we will add attributes to our created entities.
Next, we will show the relationships between the entities using the symbols mentioned above in the table. Lastly, we will group all the objects so we can copy or save the diagram as an image.

You can make your own copy of the spreadsheet above using the link attached below.
Awesome! Now let’s learn the step-by-step process of how to create an entity relationship diagram in Excel.
How to Create Entity Relationship Diagram in Excel
In this section, we will discuss the steps of how to create an entity relationship diagram in Excel using the Insert Shapes feature.
1. Firstly, let’s prepare our database. In this case, the tables we have containing data will serve as our database. So we have the customer, the order, and the product.

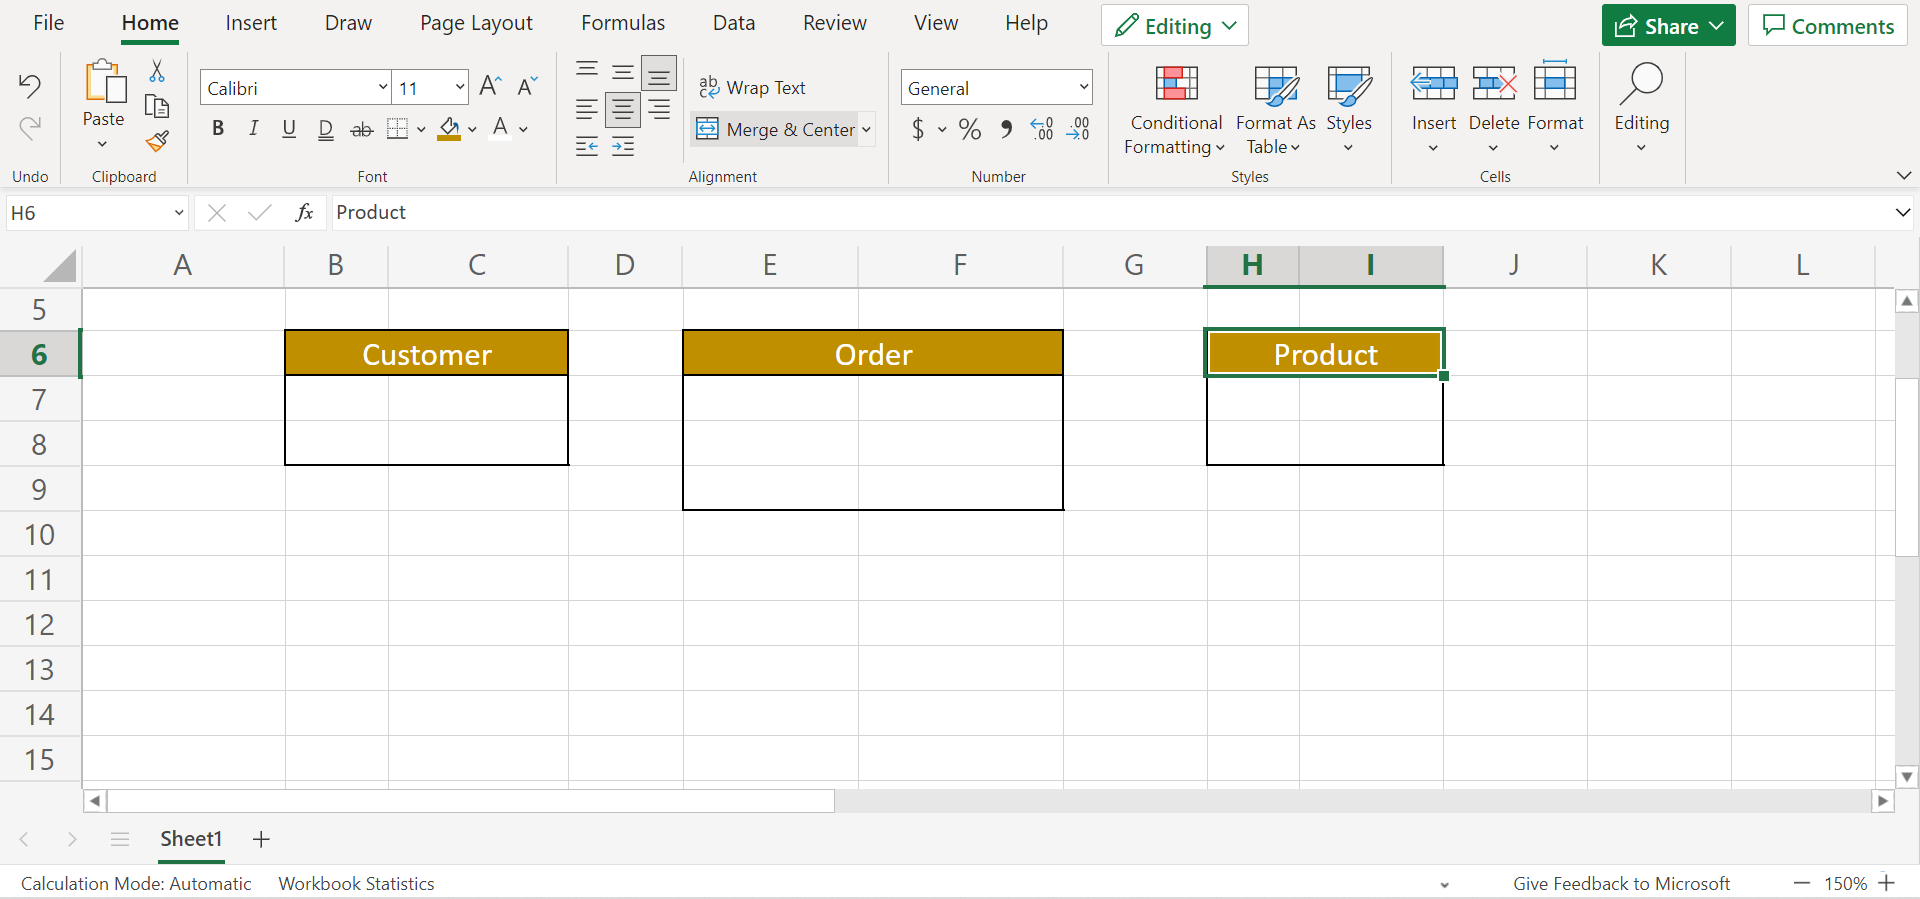
2. Secondly, we will create the entities. Since we have three tables, we need to create three entities as well. So we will utilize the cell border feature in Excel to create a rectangular box.
To do this, go to the Home tab and select the Borders dropdown menu. Next, select the appropriate Border style to form the rectangular box.

3. Additionally, we may need to use the Merge feature for the header. Then, we need to input the name of our three entities. And we may add colors to present our diagram better visually.

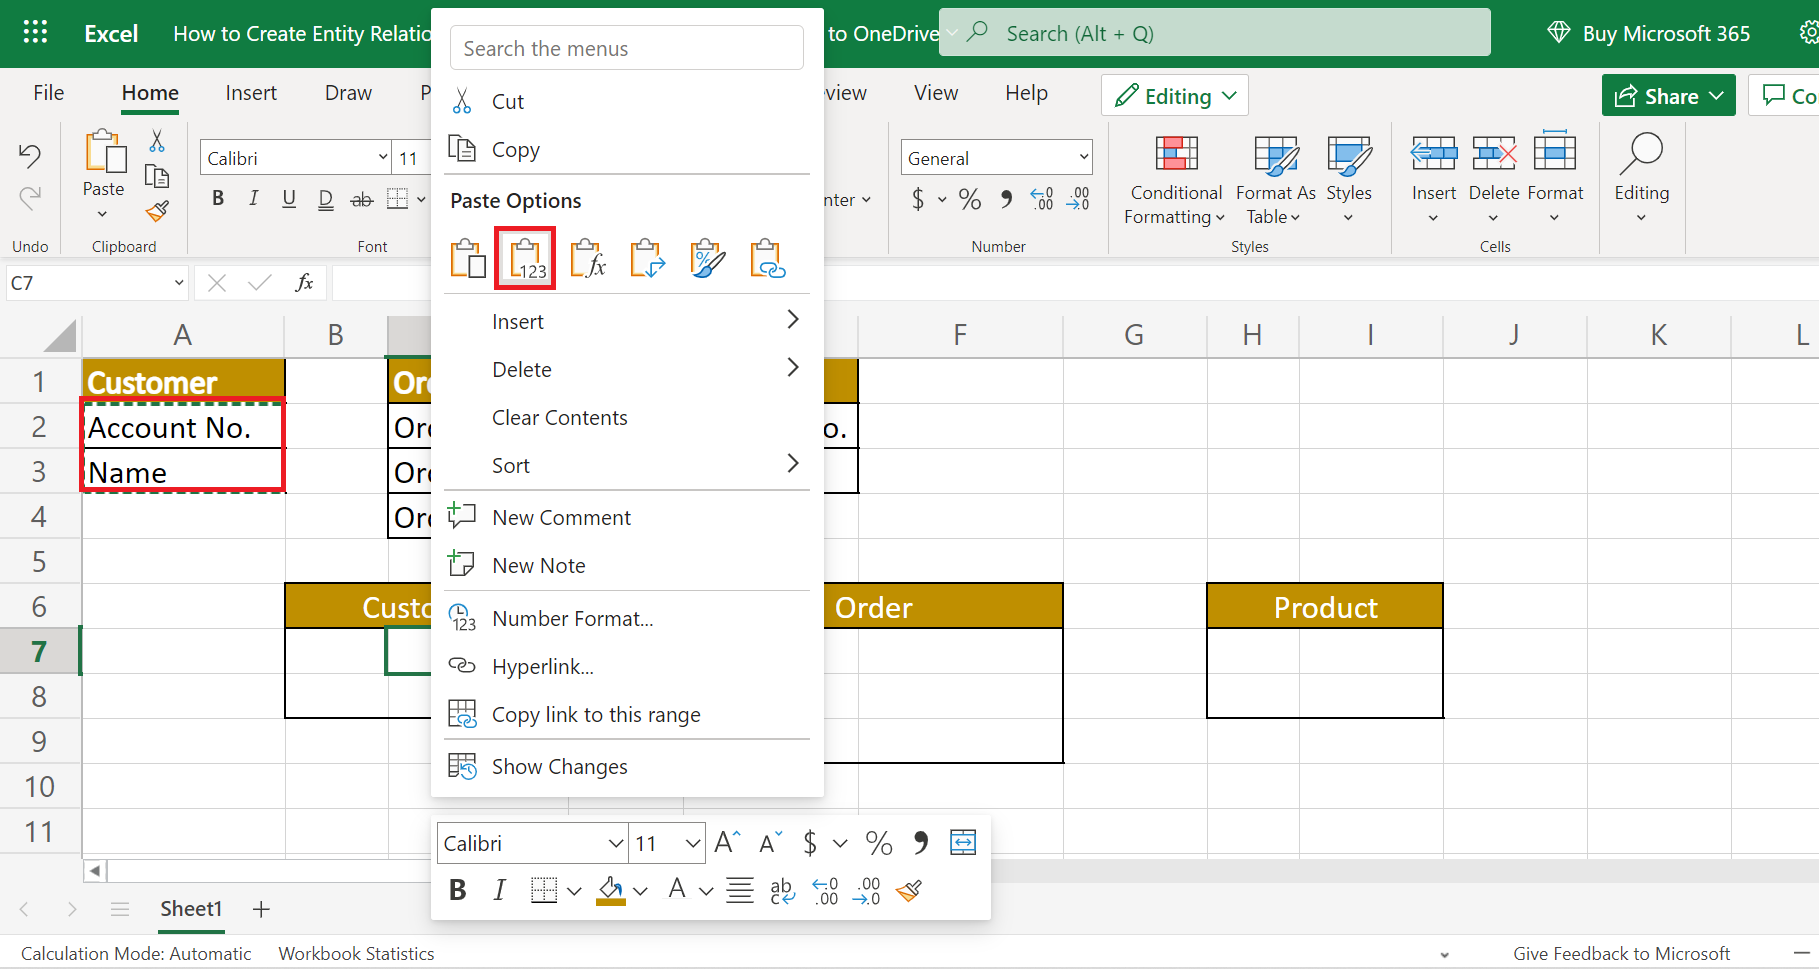
4. Next, we need to add attributes to the entities. In this case, we can copy the data from our database or tables. For instance, we can simply copy the data from our first table to paste it into our Customer entity. And do the same for the rest of the entities.

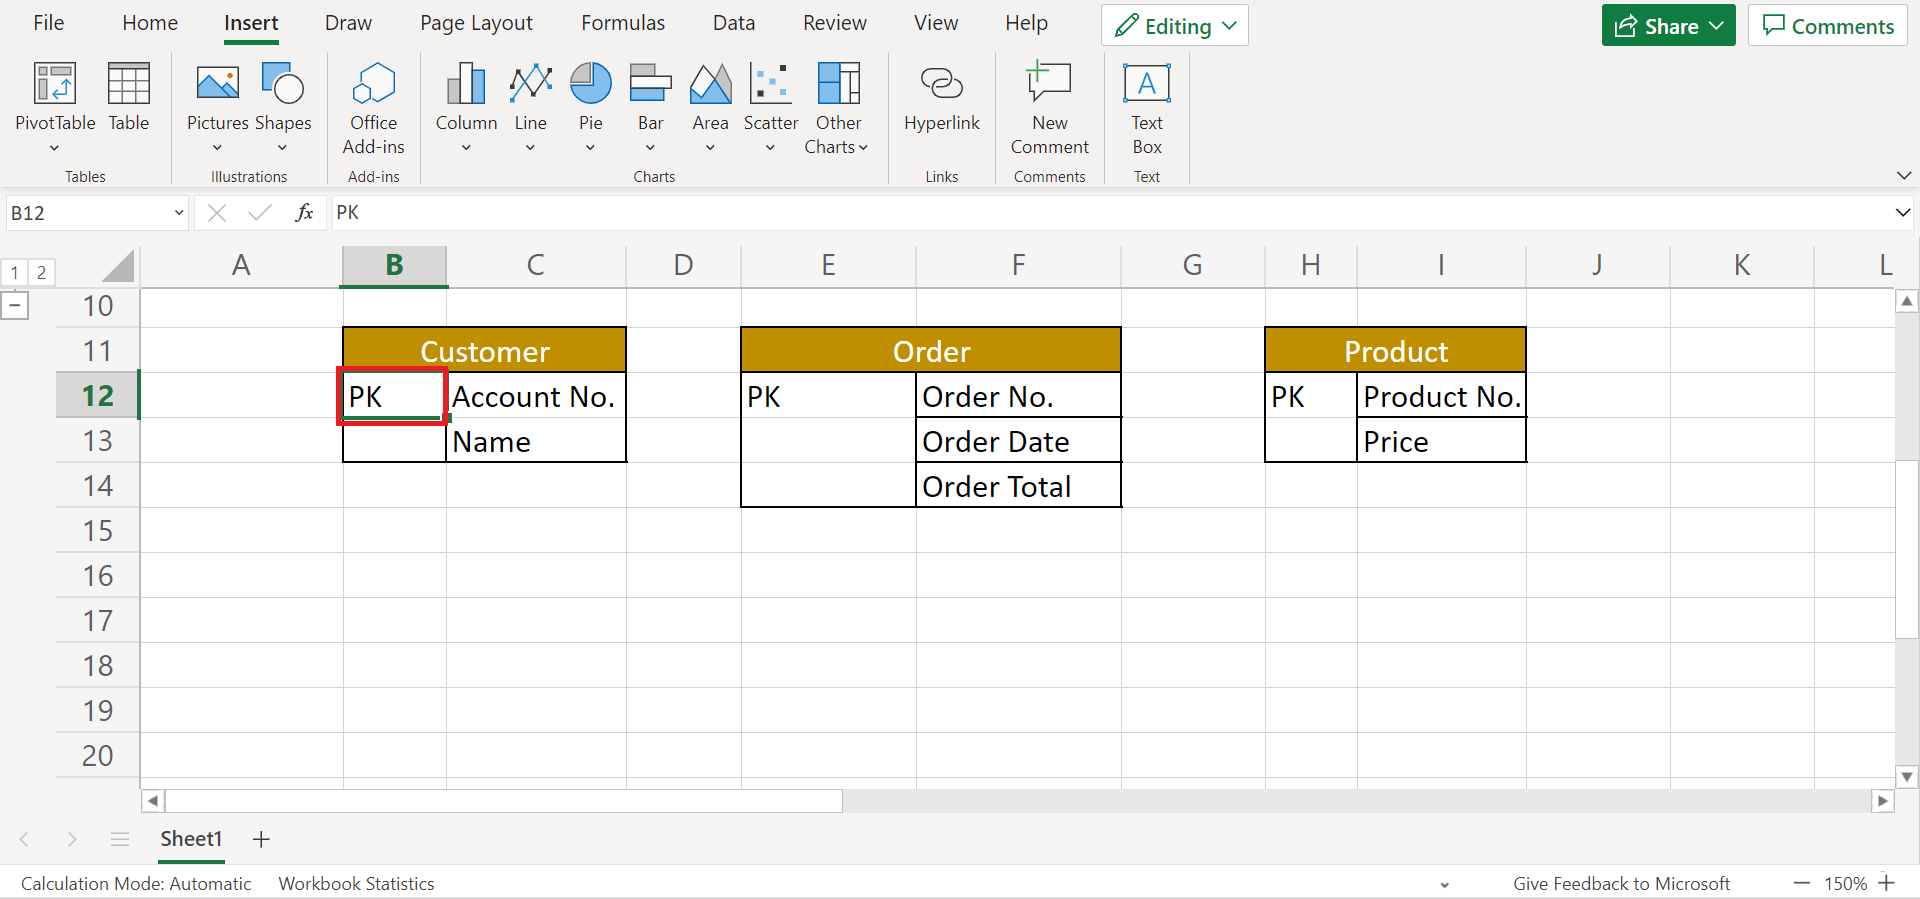
5. Furthermore, we can add details such as inputting “PK” or product key to attributes beside unique data values. For example, each order has a unique order number assigned to them.

6. Then, we will copy each range of cells or entities and paste each of them as pictures.

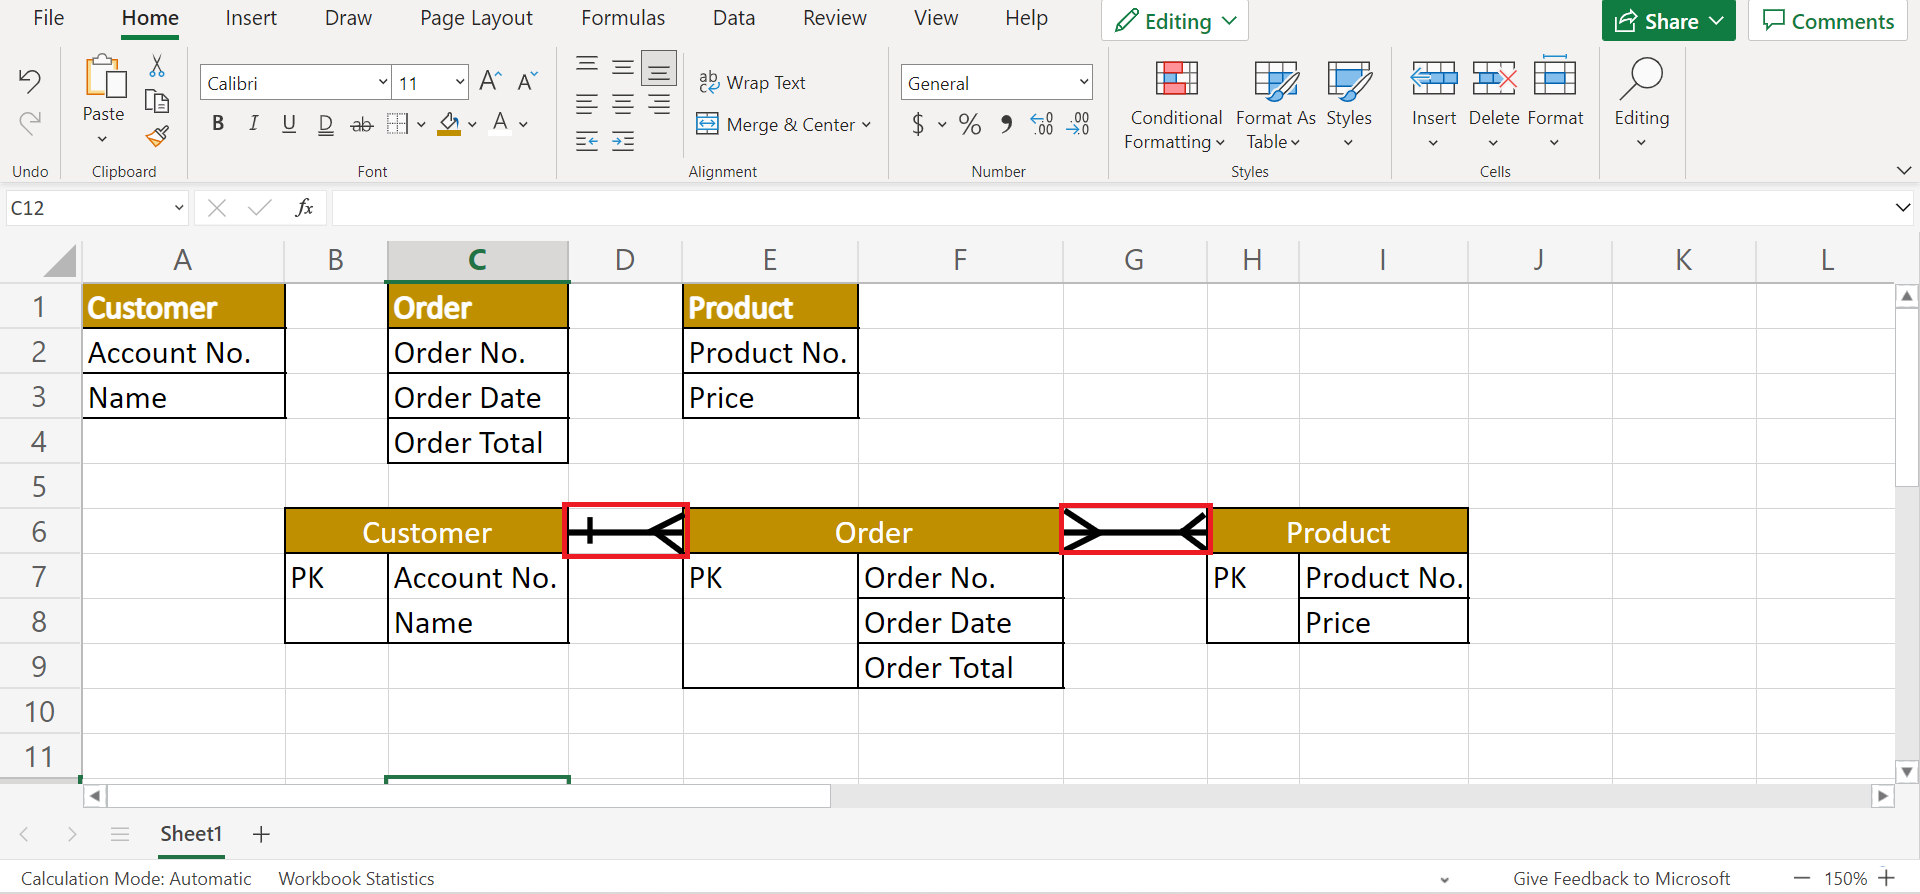
7. Afterward, we can now add the relationships between entities. So go to the Insert tab. Then, click on Shapes. In the dropdown menu, select the lines.

8. Now, we can illustrate the necessary symbols for the relationships of the entities. For instance, the relationship of the Customer entity to the Order entity is one-to-many because one customer can order multiple times.
Since an order can have several products, the relationship between the Order entity and Product entity is many-to-many.

9. Lastly, select the entire thing. Then, go to the Data tab. Finally, select Group to group all the cells and lines to have one diagram.

10. And tada! We have successfully created an entity relationship diagram in Excel using the Insert Shapes feature.

And that’s pretty much it! You have learned the step-by-step process of how to create an entity relationship diagram in Excel. Furthermore, we have discussed the three important components in creating an entity relationship diagram. Now you can apply this learning in your work and create your own diagram.
Are you interested in learning more about what Excel can do? You can now use the various other Microsoft Excel formulas available to create great worksheets that work for you. Make sure to subscribe to our newsletter to be the first to know about the latest guides and tutorials from us.


