This guide will explain how to use the VAR.P function in Google Sheets.
When we need to calculate the variance based on an entire population, we can easily do this using the VAR.P function in Google Sheets.
Table of Contents
The rules for using the VAR.P function in Google Sheets are the following:
- The
VAR.Pfunction returns the variance based on the entire population, which is a measure of the spread of the data set. - The
VAR.Pfunction specified taking a maximum of 30 arguments. However, Google Sheets supports an arbitrary number of arguments for this function. - If the total number of values inputted as value arguments is not at least two, the
VAR.Pfunction will return a #DIV/0! error. - The
VAR.Pfunction will ignore any value arguments that are non-numeric or include text. - Moreover, the
VAR.Pfunction takes the sum of the squares of each value’s deviation from the mean and divides it by the number of such values.
Google Sheets has several functions we can use to calculate the variance of a data set. Variance is a measure of the spread of a data distribution. It measures the distance of the data points from the mean of the data set.
To begin with, we can use the VAR.P function, which is used to calculate the variance of a data set from a population. If we only have a sample from a population, we can utilize the VAR.S function instead to calculate the sample variance.
Additionally, we also have the DVARP function, which returns the variance of a population based on a selected database and specified criteria.
In this guide, we will provide a step-by-step tutorial on how to use the VAR.P function in Google Sheets. We will also explore the syntax and a real example of using the function.
Great! Let’s dive right in.
The Anatomy of the VAR.P Function
The syntax or the way we write the VAR.P function is as follows:
=VAR.P(value1,[value2,...])
- = the equal sign is how we begin any function in Google Sheets.
- VAR.P() refers to our
VAR.Pfunction. This function is used to calculate the population variance of a data set, which is a measure of how much the individual data points in the data set deviate from the mean. - value1 is the only required argument. This refers to the first value or range of values in the data set we want to use to calculate the variance.
- value2 is an optional argument. This refers to the additional values or ranges of values in the data set we want to use to calculate the variance.
Note: The VAR.P function is a relatively new function that replaces the VARP function in Google Sheets. Hence, we recommend using the new VAR.P function.
Calculating the Variance Using the VAR.P Function
The method in which the VAR.P function calculates the variance differs from the calculation of variance across a sample. The VAR.P function takes the sum of the squares of each value’s deviation from the mean and divides it by the number of such values.
Let’s tackle how the VAR.P function calculates the variance of the entire population.
Firstly, the VAR.P function computes the mean (average) of the data set. Then, it will subtract the mean from each value in the data set, resulting in a set of deviations.
Next, the VAR.P function will square each deviation. Lastly, it will calculate the average of the squared deviations. The result is the population variance, which is a measure of the dispersion of the data set.
A Real Example of Using VAR.P Function in Google Sheets
Let’s say we have a data set showing the percentage grades of the entire class. We want to use the data to estimate the variance of the percent grades of the entire class.
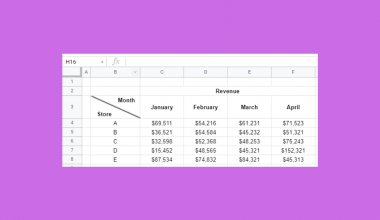
Our initial data set would look like this:

In the spreadsheet above, we have the information of the entire class. Since the given data set is the entire population, we will utilize the VAR.P function to calculate the population variance.
We can apply the formula below to complete this task:
=VAR.P(B2:B10)

There is only one required argument for the VAR.P function to work properly. In the formula above, we simply selected the entire range containing the data points we need to calculate the variance, which is B2:B10.
Our final data set would look like this:

You can make your own copy of the spreadsheet above using the link below.
Amazing! Now we can dive into the steps of using the VAR.P function in Google Sheets.
How to Use VAR.P Function in Google Sheets
1. First, we will select an empty cell in the data set to display the sample variance. To start, we will type in an equal sign and the function name. Our formula would be “=VAR.P(”.

2. Then, we will simply select the entire range containing the data points we want to use to calculate the population variance. In this case, our final formula would be “=VAR.P(B2:B10)”.

3. We will press the Enter key to return the result.
And tada! We have successfully used the VAR.P function in Google Sheets.
You can apply this guide whenever you need to calculate the variance of a sample. You can now use the VAR.P function and the various other Google Sheets formulas available to create great worksheets that work for you.
FAQs
1. What is the difference between the VAR.P function and the VAR.S function?
The VAR.P function calculates the variance for an entire population dataset. It considers all the data points in the population and divides the sum of squared deviations by the total number of data points.
On the other hand, the VAR.S function calculates the variance for a sample dataset. It is used when you have a subset of data from a larger population. VAR.S divides the sum of squared deviations by (n-1), where ‘n’ is the number of data points in the sample.
2. What are the common mistakes when using the VAR.P function?
The VAR.P function is restricted to numerical data, causing an error if non-numerical values like text are included in the dataset. Additionally, a minimum of two data points is required for the function to work properly. Otherwise, it will result in an error.
That’s pretty much it! Make sure to subscribe to our newsletter to be the first to know about the latest guides and tutorials from us.