This guide will discuss how to use the VAR.S function in Google Sheets.
When we need to calculate the variance based on a sample, we can easily do this using the VAR.S function in Google Sheets.
Table of Contents
The rules for using the VAR.S function in Google Sheets are the following:
- The
VAR.Sfunction is used to calculate the variance of a data set if the data set is considered from a population sample. - We can include up to 30 values or ranges in total in the optional value2 argument.
- The
VAR.Sfunction calculates the sample variance. If we want to calculate the population variance, we can use the VAR.P function instead. - When inputting a range of values, we must ensure the range only includes cells with data points. If we include empty cells or cells with non-numeric values in the range, it may result in an error or incorrect result.
Google Sheets has several functions we can use to calculate the variance of a data set. Variance is a measure of the spread of a data distribution. It measures the distance of the data points from the mean of the data set.
To begin with, we can use the VAR.S function, which is used to calculate the variance of a sample population. If we have a data set from a population, we can utilize the VAR.P function instead to calculate the sample variance.
In this guide, we will provide a step-by-step tutorial on how to use the VAR.S function in Google Sheets. Additionally, we will explore the syntax and a real example of using the function.
Great! Let’s dive right in.
The Anatomy of the VAR.S Function
The syntax or the way we write the VAR.S function is as follows:
=VAR.S(value1,[value2,...])
- = the equal sign is how we start any function in Google Sheets.
- VAR.S() refers to our
VAR.Sfunction. This function is used to calculate the sample variance of a data set, which is a measure of how much the individual data points in the data set deviate from the mean. - value1 is the only required argument. This refers to the first value or range of values in the data set we want to use to calculate the variance.
- value2 is an optional argument. This refers to the additional values or ranges of values in the data set we want to use to calculate the variance. Furthermore, we can include up to 30 values or ranges in total.
Note: The VAR.S function is a relatively new function that replaces the VAR function in Google Sheets. Hence, we recommend using the new VAR.S function.
Common Mistakes in Using VAR.S Function
The VAR.S function only has one required and one optional argument to perform properly. However, we still need to be careful when using some things to ensure the function properly works.
Firstly, ensure that our data set is a sample. Remember that the VAR.S function calculates the sample variance. If we have a population data set, we must use the VAR.P function instead.
Secondly, we must include enough data points in the data set. To calculate the sample variance, we need at least two data points. If we only have one data point, the VAR.S function will return a #DIV/0! Error.
Next, we must avoid including non-numeric values or empty cells in the range when using the VAR.S function. This can result in an error or incorrect result. Make sure to only include cells with data points in the range.
Lastly, check the syntax of the formula. Check the syntax of the function call is correct, including the proper placement of commas, the use of parentheses, and the sign of the values.
A Real Example of Using VAR.S Function in Google Sheets
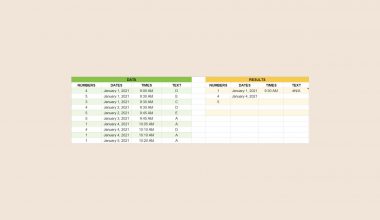
Let’s say we have a data set showing the percentage grades of one senior class. We want to use the data to estimate the variance of the percent grades of the class.
Our initial data set would look like this:

In the spreadsheet above, we only have information about one senior class, which is a subset of all the senior classes. Since the given data set is a sample from the population, we will utilize the VAR.S function to calculate the sample variance.
We can apply the formula below to complete this task:
=VAR.S(B2:B10)

There is only one required argument for the VAR.S function to work properly. In the formula above, we simply selected the entire range containing the data points we need to calculate the variance, which is B2:B10.
Our final data set would look like this:

You can make your own copy of the spreadsheet above using the link below.
Amazing! Now we can dive into the steps of using the VAR.S function in Google Sheets.
How to Use VAR.S Function in Google Sheets
1. First, we will select an empty cell in the data set to display the sample variance. To start, we will type in an equal sign and the function name. Our formula would be “=VAR.S(”.

2. Then, we will simply select the entire range containing the data points we want to use to calculate the sample variance. In this case, our final formula would be “=VAR.S(B2:B10)”.

3. We will press the Enter key to return the result.
And tada! We have successfully used the VAR.S function in Google Sheets.
You can apply this guide whenever you need to calculate the variance of a sample. You can now use the VAR.S function and the various other Google Sheets formulas available to create great worksheets that work for you.
FAQs
1. When to use the VAR.S function versus the VAR.P function?
We can use the VAR.P function when the data set represents all the data points of the population of interest.
Furthermore, we can also use the VAR.P function if the data set represents the sample of a population; however, you do not wish to use your findings to generalize or estimate the population.
Then, we can utilize the VAR.S function when the data set represents the sample of a population, and we want to use the result to estimate the population.
That’s pretty much it! Make sure to subscribe to our newsletter to be the first to know about the latest guides and tutorials from us.