This guide will explain how to add a comment to a data point on a chart in Excel.
Excel has many different types of charts available for everyone to use to present their data. It is a good way to visually present data and results and makes it easier for everyone to understand. But sometimes, this is not enough.
Although charts can present our data numerically, we sometimes need additional information or text to point out important information on the chart explicitly.
One way to do this is to add a comment to a data point on a chart in Excel.
In Excel, a comment is commonly used to explain a part of the spreadsheet to others. So it functions similarly to a note that people who may not know enough about the data can refer to.
There are several ways we can perform this task. But we will discuss the easiest method to add a comment to a data point on a chart in Excel.
Let’s take an instance where you would apply this.
Suppose you are creating a sales report and utilizing a stacked bar chart to visualize the data. And this chart will be shared with the different companies. Since people will most likely just check the chart to save time, you want them to know an important conclusion.
In this case, you want to share which product had the lowest sale this month explicitly. So you utilize a text box to add a comment to the lowest data point on the chart.
Great! Now let’s dive into a real example of adding a comment to a data point on a chart in Excel.
A Real Example of Adding Comment to a Data Point on Chart in Excel
Let’s look at our data and chart. For instance, we have already made the stacked bar chart for our data. 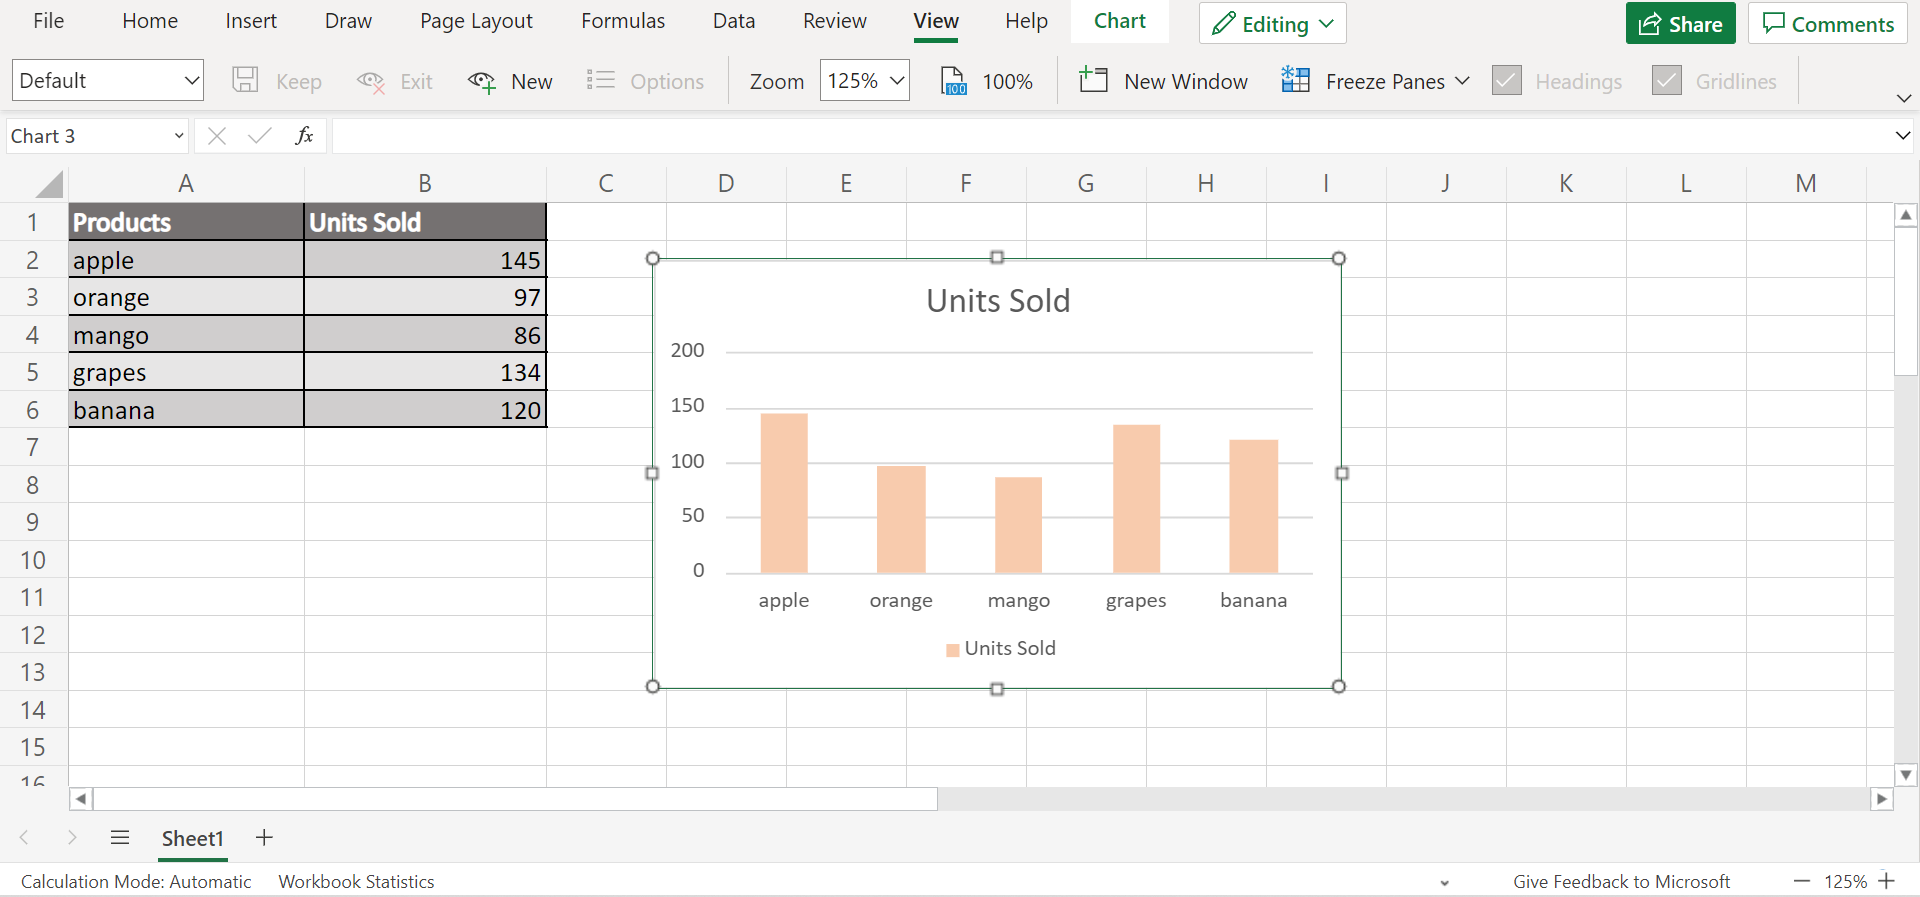
Since we want to point out the product with the lowest sale, we inserted a text box on the chart. And the text box can be formatted into different shapes, colors, and outlines to fit any chart or preference.
With the text box formatted, we can write any comment we want to emphasize. Then, we can drag the text box to the specific data point we are referring to. So this ensures that everyone knows which data point we are talking about.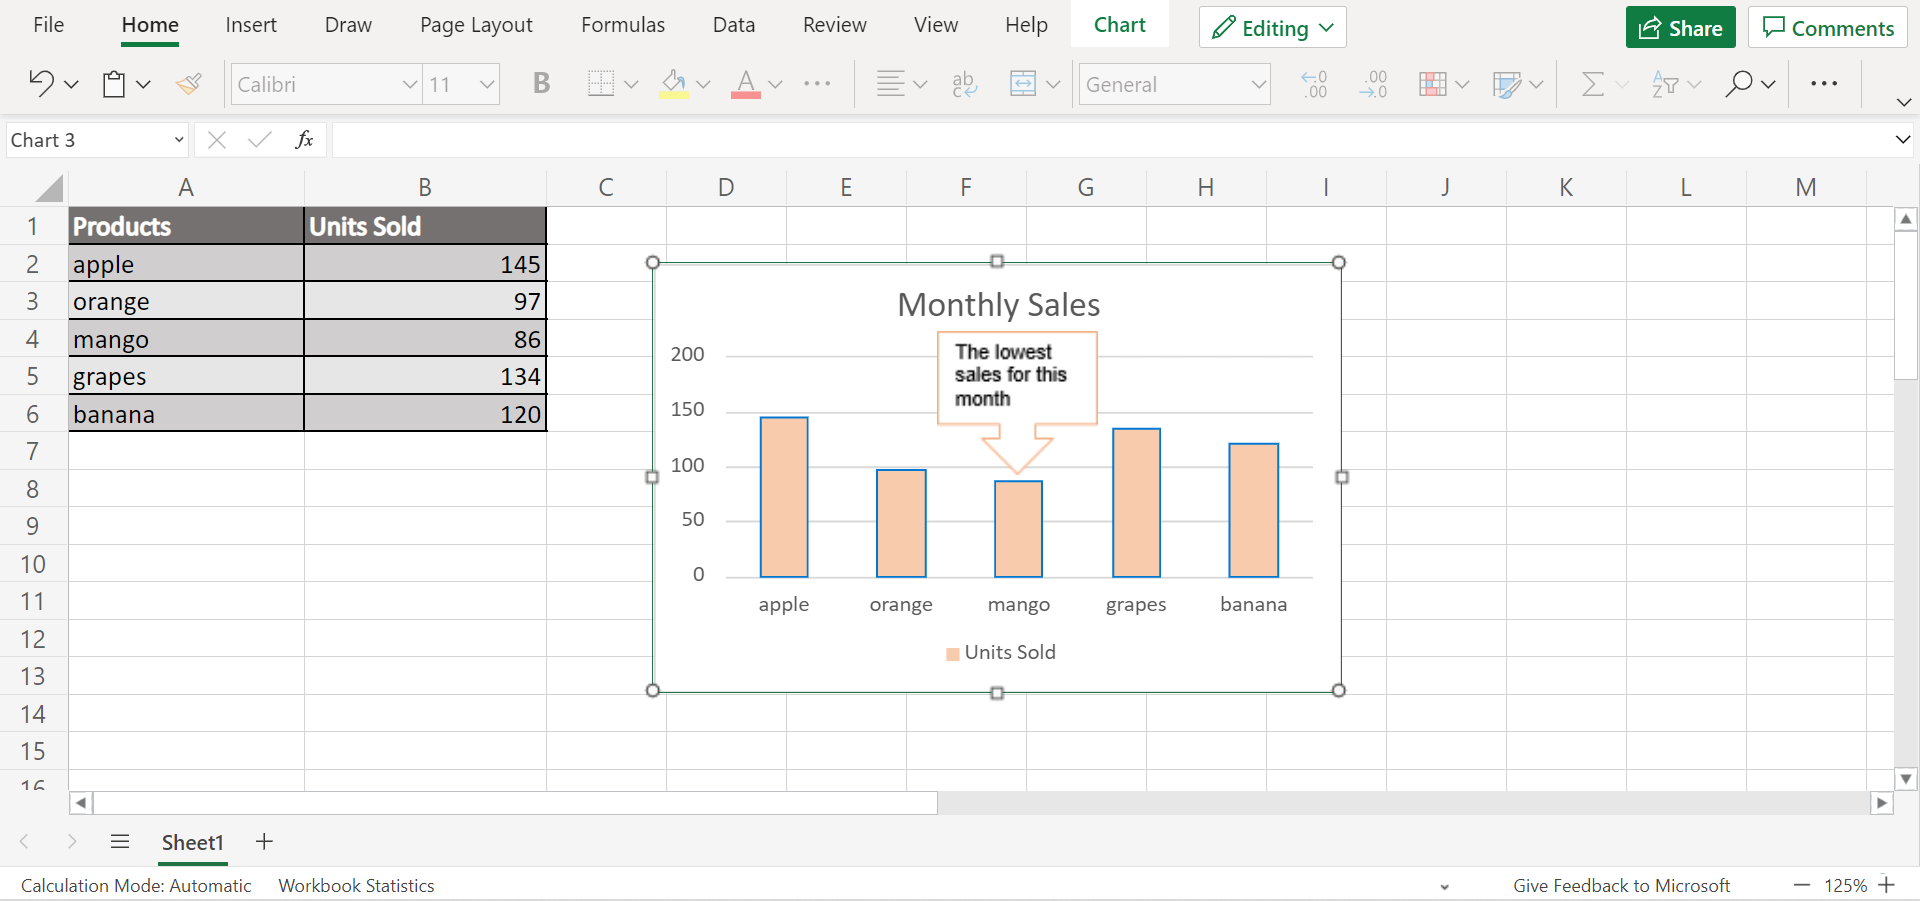
Additionally, we can add a description for the chart using alt text. Alt text is used to inform the viewers about the content or description of an image or, in this case, a chart. So the alt text appears every time we hover over the data points.
You can make your own copy of the spreadsheet above using the link attached below.
Awesome! Now let’s learn the step-by-step process of how to add a comment to a data point on a chart in Excel.
How to Add Comment to a Data Point on Chart in Excel
In this section, we will explain the process of how to add a comment to a data point on a chart in Excel. Each step contains pictures to guide you along the way.
1. First, create your chart using any chart type applicable to your data. In this case, we have a stacked bar chart. Additionally, if you already have an existing file, you can go ahead and open that file.
2. Second, go to the Insert tab. From there, click Text Box. 
3. After, a default rectangle text box will appear. This is what we will use to write our comments. Then, simply double-click the text box in the middle to start writing.
To format your text, go to the Home tab. Then, highlight your text and change the font and font size to your preference.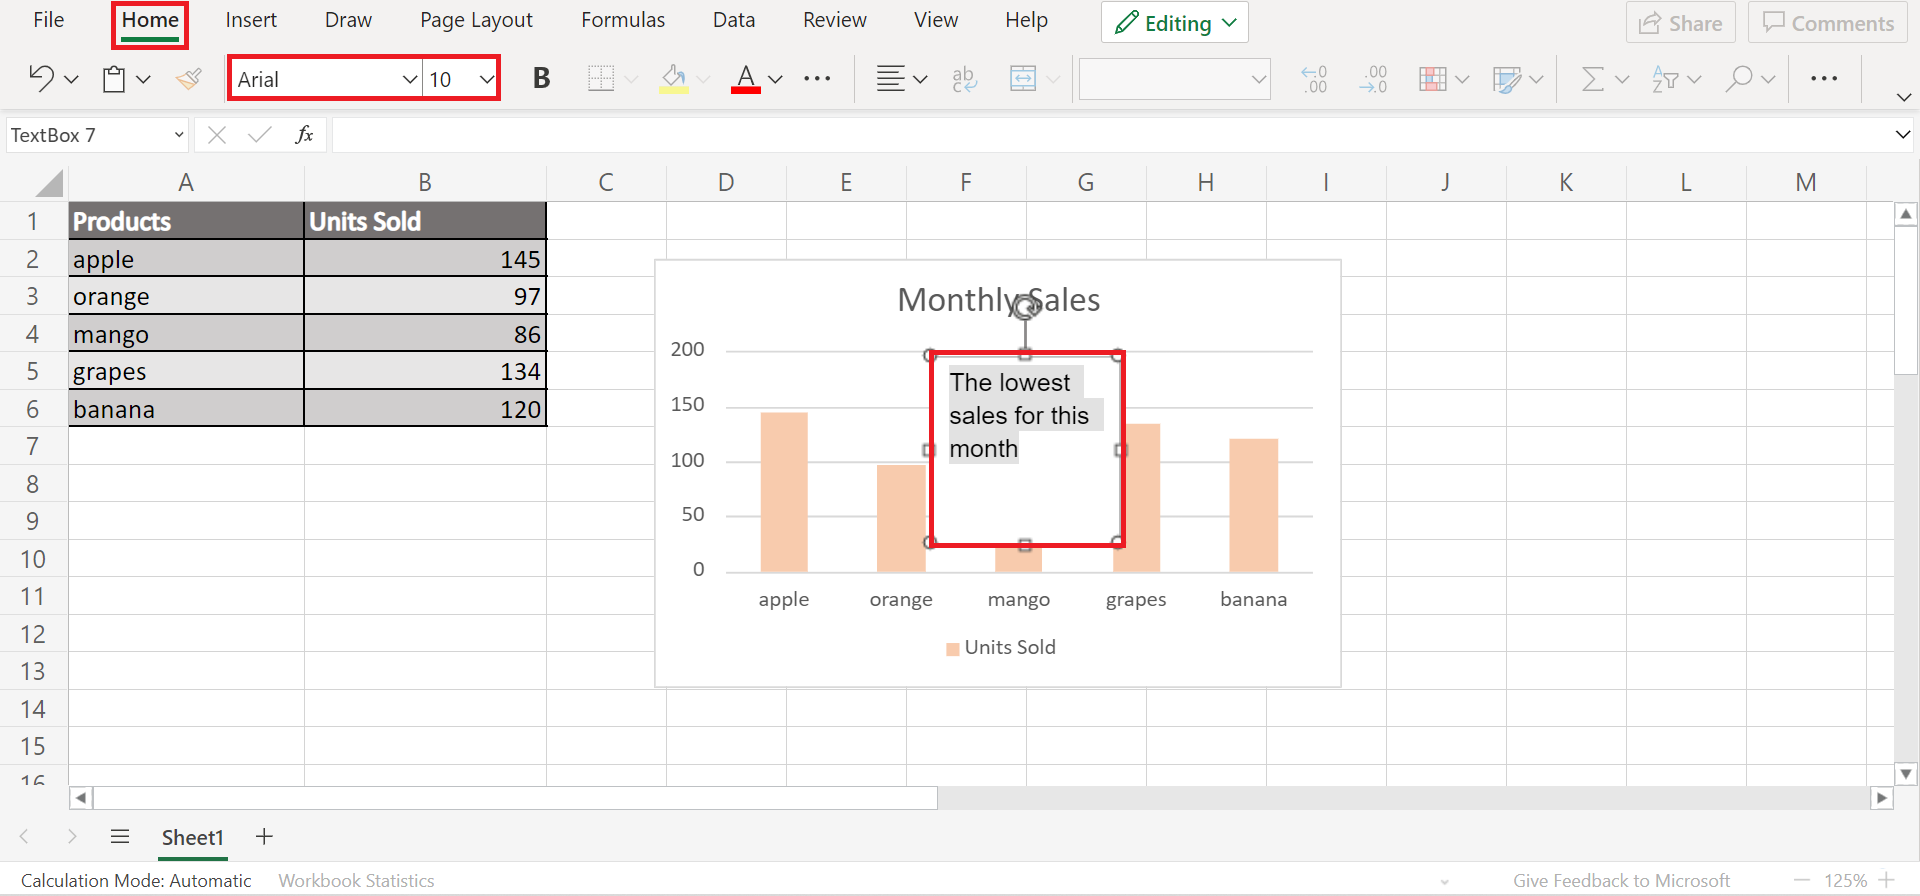
4. Next, let’s format the text box itself. Make sure the text box is selected for the Shape tab to appear. From that tab, click the Change Shape drop-down menu. Excel offers a variety of shapes for you to choose from.
Since we are commenting on a specific data point, let’s choose the Down Arrow Callout shape. Also, we can change the color of the text box. 
Note: Make sure to choose a shape with an arrow or anything that can point out a data point on a chart.
5. After formatting our text box, let’s resize it to fit inside the chart. To resize a text box, just hover the arrow over its border until a two-headed arrow appears. Lastly, let’s move the text box so that the arrow points to the data point we are commenting on.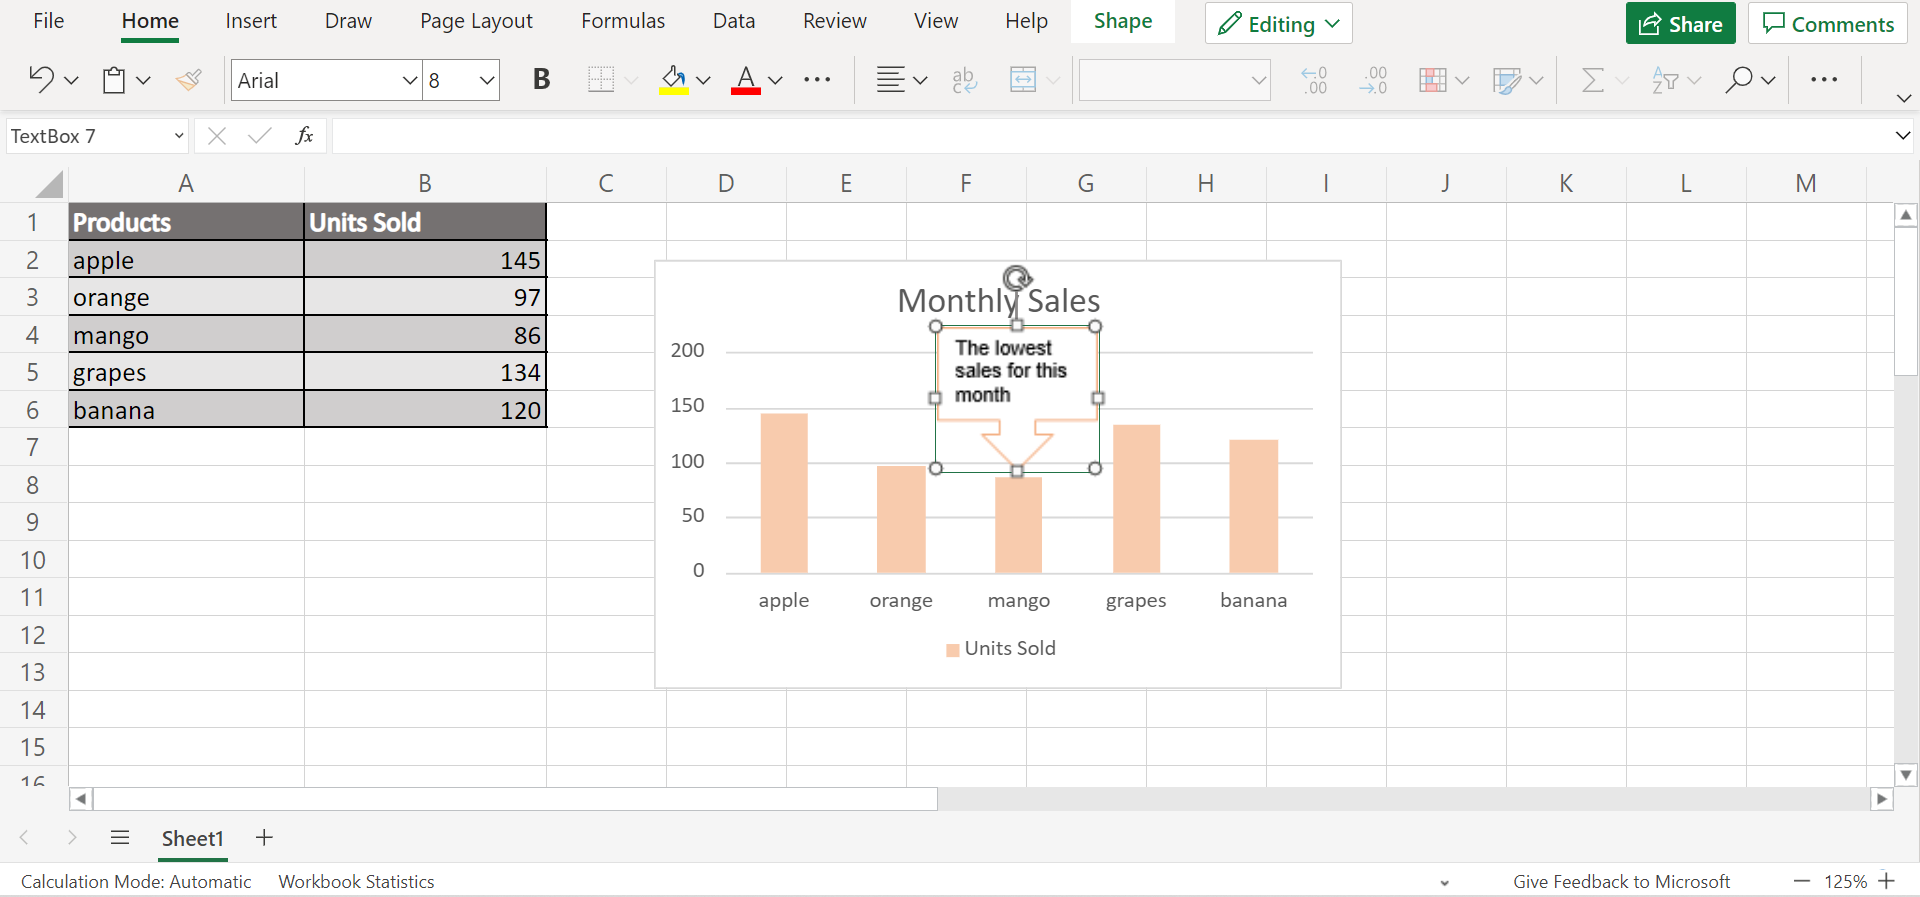
6. Additionally, let’s learn how to add alt text to a chart in Excel. Simply right-click on any part of the chart and select Alt Text.
7. In the Alternative Text window, we can write the title and description of the chart. Furthermore, you can write what applies to your data or report. After writing the title and description, click OK to apply.
8. And tada! We have added a comment to a data point on a chart in Excel. We even added an alt text. This way, whenever people click on any data point, a description will appear.
And that’s it! Wasn’t this easy? You have successfully learned how to add a comment to a data point on a chart in Excel. Now you can add a comment or note to your chart whenever you need it.
Are you interested in learning more about what Excel can do? You can now use the various other Microsoft Excel formulas available to create great worksheets that work for you. Make sure to subscribe to our newsletter to be the first to know about the latest guides and tutorials from us.
[powerkit_subscription_form title=”Get emails from us about Google Sheets.” text=”Our goal this year is to create lots of rich, bite-sized tutorials for Google Sheets users like you. If you liked this one, you’ll love what we are working on! Readers receive ✨ early access ✨ to new content.” list_id=”default” bg_image_id=”2256″