

The AVERAGEA function in Google Sheets is used to calculate the numerical average value of a dataset.
Table of Contents
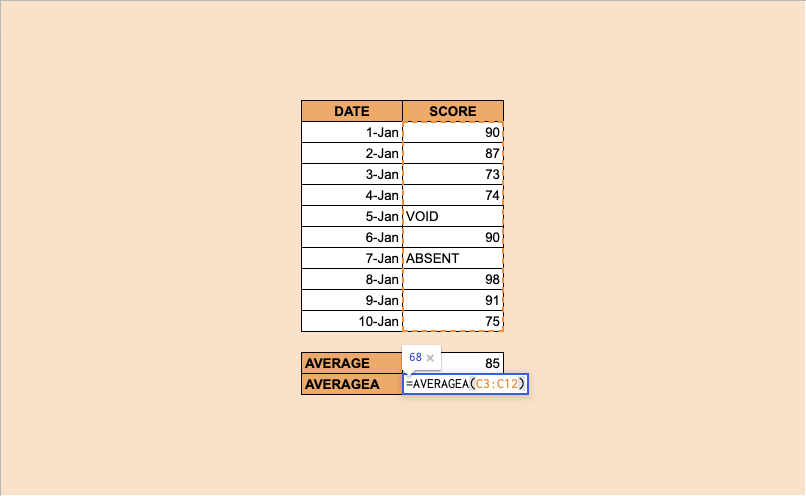
AVERAGEA is a statistical function that calculates the average value of a group of values. It differs from the AVERAGE function, as it also counts in numbers that may have been formatted as text – for example, 1 and 0 as TRUE and FALSE, dates, and so on. The AVERAGE function would just ignore these “numbers” otherwise.
This function is useful in the area of statistics.
When might you use the AVERAGEA function, among all other types of averages and means? Let’s look at an example.
You are looking for your average score from your semester’s quizzes. Some of the quizzes you missed will be counted as a 0. You have them listed out in a column.
How should we go about this problem?
The AVERAGEA function is used to get the average or mean of the combined value arguments. In other words, it is the sum of the values of the dataset, divided by the number of values in the dataset.
The Anatomy of AVERAGEA Function in Google Sheets
The syntax of the AVERAGEA function is as follows:
=AVERAGEA(value1, [value2, ...])
Let’s have a look at each part of the function to understand what is going on here:
=is the equals sign that starts off any function in Google Sheets.AVERAGEAis the name of our function.value1is the first value or range of the dataset.value2, ...are the additional values or ranges to be included in the dataset. These are optional values.
Note that even with the Google Sheets specification of a maximum of 30 arguments, the function will still support an arbitrary number of arguments.
Again, any text within the dataset will be set to 0, and included in the calculation. If you need to have these value ignored, use the AVERAGE function.
A Real Example of Using AVERAGEA Function
You may be curious as to why the AVERAGEA function exists, when there are other ways to calculate averages.
The AVERAGE function helps to create correct calculations by including values that seem like text but are actually important to the dataset. This is helpful in a variety of very specific tasks.
Let’s look at the example below to see how to use the AVERAGEA function in Google Sheets.
Calculating the average in Google Sheets
This is a simple problem. It is a simplified task to help you understand what the function can be used for.

In the equation, it will look like this:
=AVERAGEA(C3,C17)
It will result in an average of 61.
While the regular AVERAGE calculates it as 70, but this is not completely accurate. The AVERAGEA takes note of this and calculates the average properly by including the days where you were absent and thus scored a 0.
This simple problem can be practiced to perfection. Use the link below to get a copy of this problem set:
How to Use AVERAGEA Function in Google Sheets
In this section, we will show you a step-by-step process on how to use the HARMEAN function in Google Sheets.
Another feature of HARMEAN is to take of the outliers in a dataset.
In this problem, we are looking at a number of workshop attendees on certain days. We will find the harmonic mean of the attendees and compare it to the average.
Using AVERAGEA Function In Google Sheets
- To begin, prepare your spreadsheet with the information you want to check.

- Start to fill in the
AVERAGEAfunction in the cell you want it to appear. In this example, we pick cell F3.

- Start by adding in the
AVERAGEAfunction.

- Start by putting in the array of data you want to analyze. You will be able to see a preview.

- You’re done! But now, let’s compare to the regular average.

- You’ll notice that they have significantly different answers to offer, but the harmonic mean treats outliers in a more accurate manner.

The AVERAGEA function can help make accurate findings from your data.
And there you have it – you can now use the AVERAGEA function in Google Sheets together with the other numerous Google Sheets formulas to create even more effective formulas.


